Five read-only diagnostic tools for troubleshooting a MikroTik router
2 hours ago

This pull request gives the MikroTik server five diagnostic tools. None of them changes the router's configuration, so all five stay available in read-only mode. They are ping, traceroute, torch, a quick packet sniffer and a CPU profile, and they work for an account that has the test and sniff policies but no write policy.
Ask about this presentation
Chapters
Show transcriptHide transcript
This pull request gives the MikroTik server five diagnostic tools. None of them changes the router's configuration, so all five stay available in read-only mode. They are ping, traceroute, torch, a quick packet sniffer and a CPU profile, and they work for an account that has the test and sniff policies but no write policy.
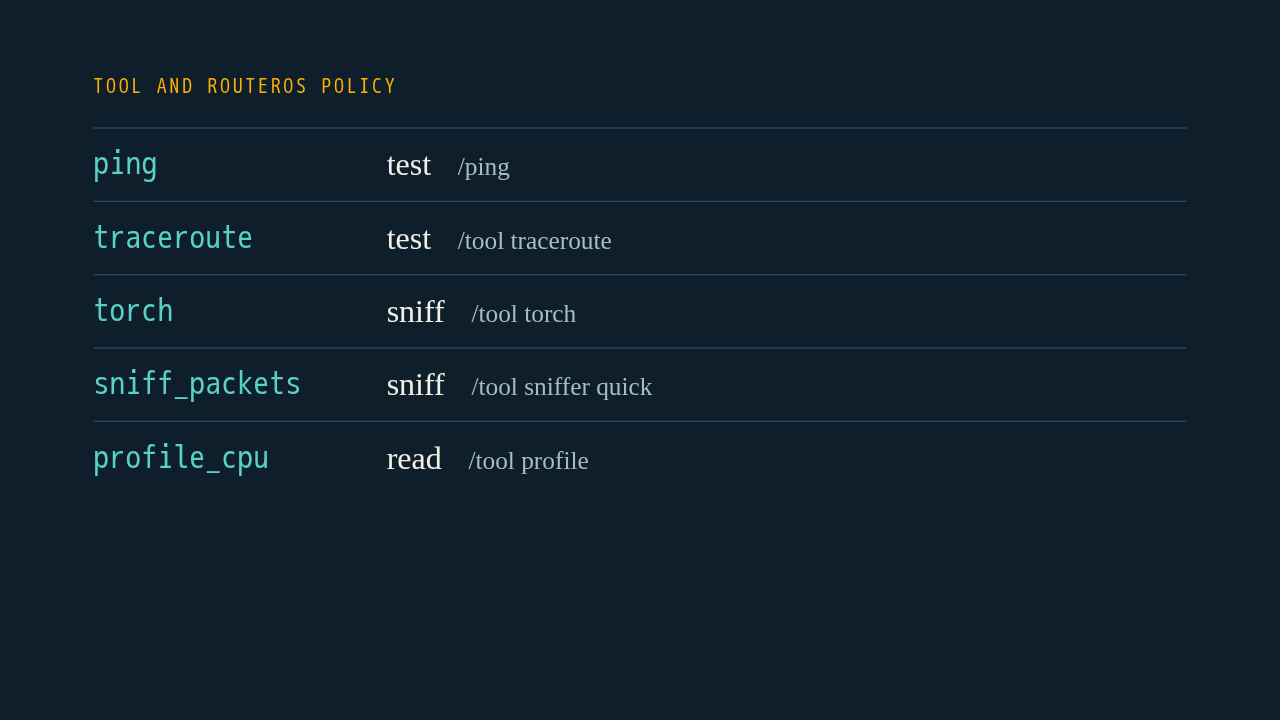
Each tool wraps one RouterOS command and needs only the policy that command needs. Ping and traceroute need test, torch and the sniffer need sniff, and the CPU profile needs only read. The sniffer shows packet headers and saves nothing on the router. The first four are also marked open world, because they reach hosts outside the router or watch live traffic.
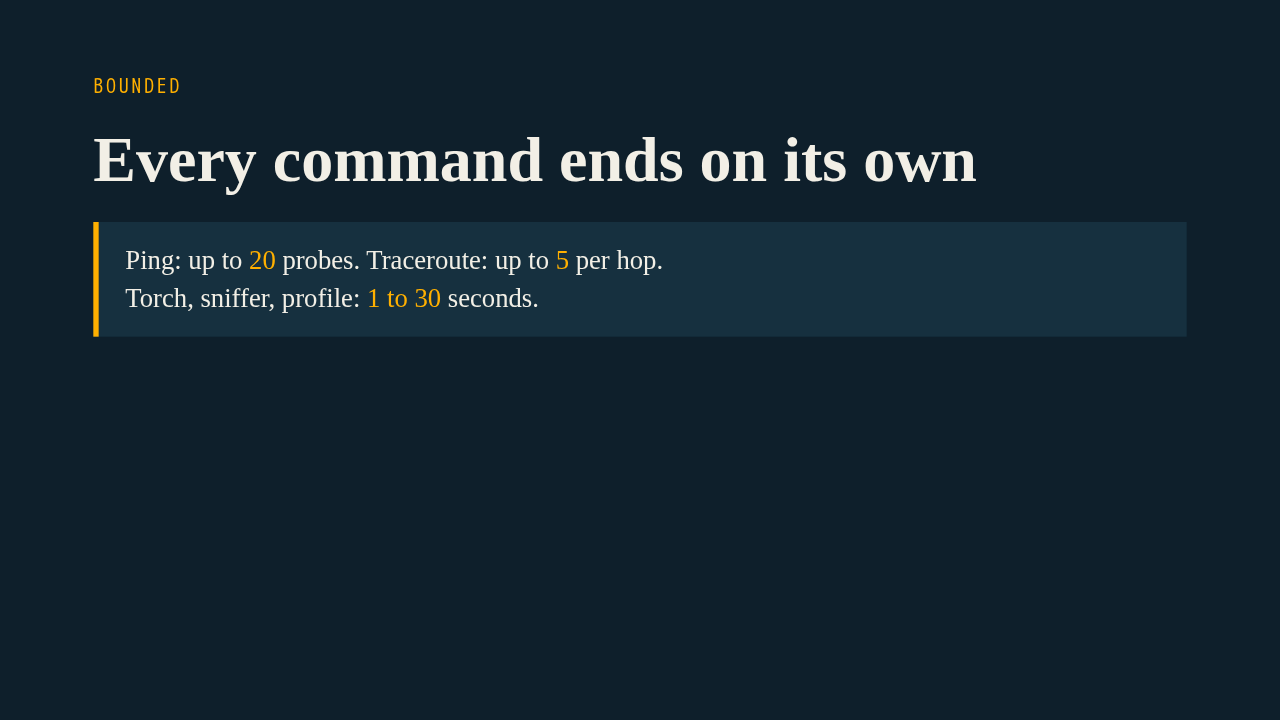
The session is non-interactive, so a command that waits would hang. Ping takes a count of at most twenty, traceroute at most five probes per hop, and torch, the sniffer and the profiler take a duration between one and thirty seconds. The output is also capped at 300 lines.
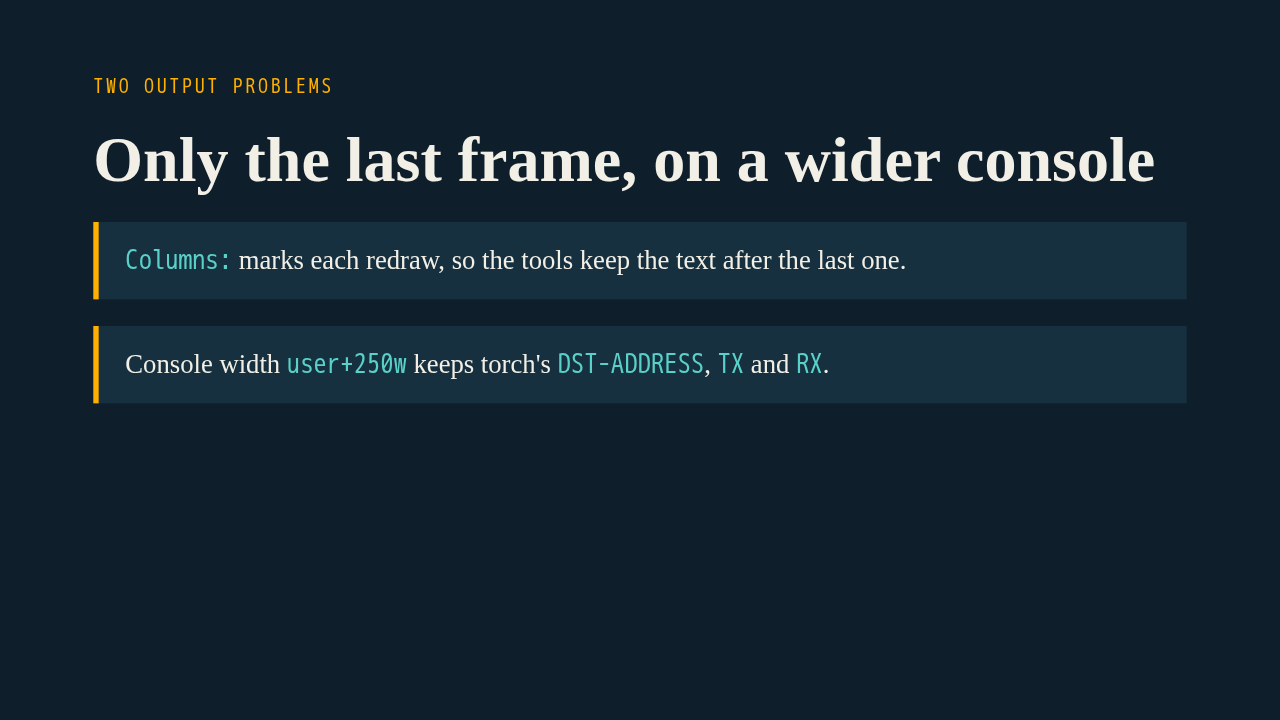
Without a terminal, RouterOS reprints the whole table on every refresh. The tools return the text after the last Columns line. They can't match the first header, because the sniffer adds or drops a column between frames, and a unit test reproduces that real output. RouterOS also lays tables out for 80 columns and drops what doesn't fit. Torch lost its destination, its traffic columns and its packet rates. So the connector gains an optional terminal width, which logs in with the plus 250 w console option. No other tool passes it, so their output is unchanged.
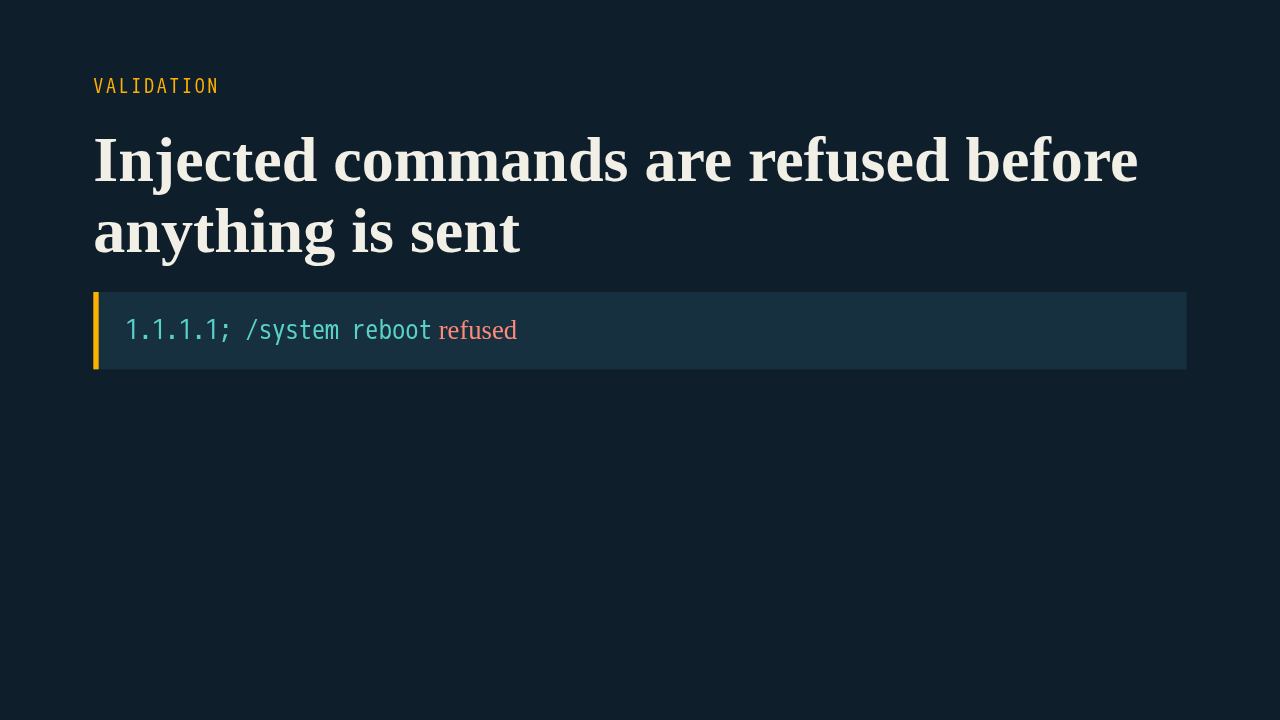
Everything the model passes ends up inside a RouterOS command. Interface and routing table names are quoted, and addresses, ports, protocols, MAC addresses, intervals and CPU selectors must match narrow patterns. So an address like this one, with a reboot command attached, is rejected before anything reaches the router. A refusal from the router, such as not enough permissions, is reported as a failure.
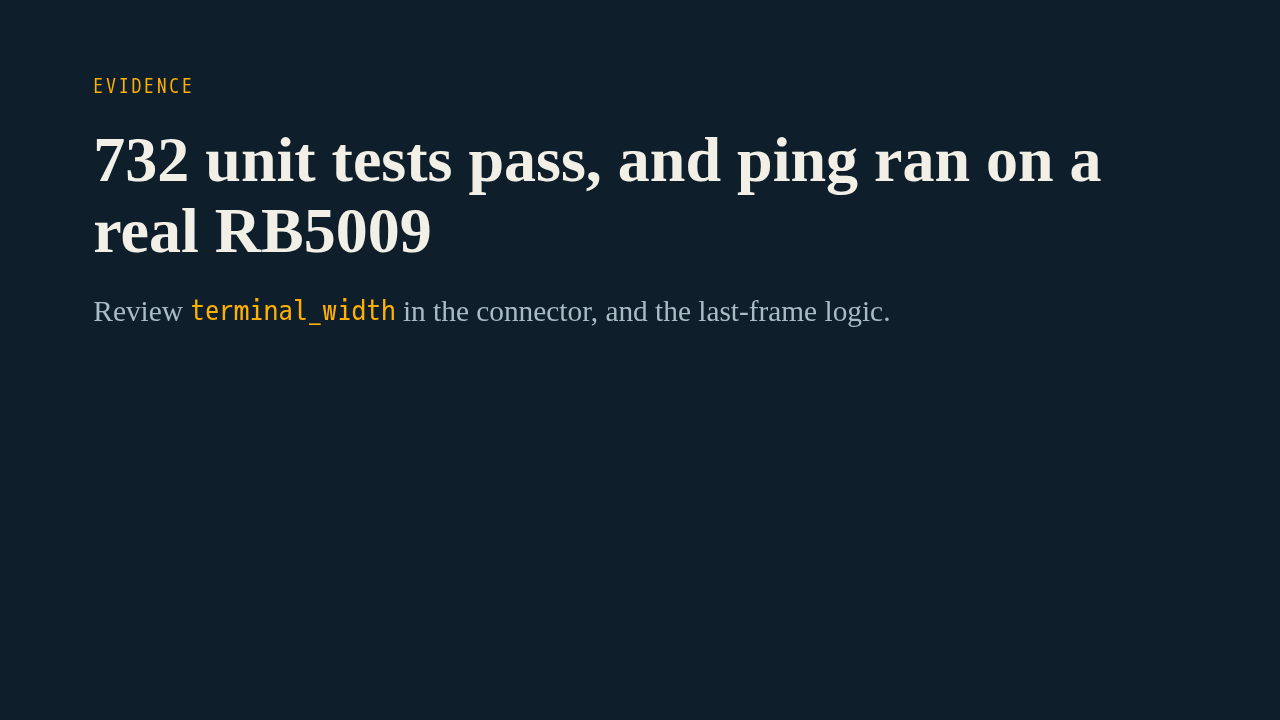
The unit suite passes with 732 tests, including exact command strings, injection rejection and the changing header. The author also ran the tools on an RB5009 with RouterOS 7.24, using a user in a group without write. The description is cut off after the ping results, so I can't tell you how the other four tools did on the device. For review, start with the new terminal width option in the connector, since it touches every command's connection path, then the last-frame extraction, which decides what the model sees.
Up next
 1:36
PR 118: draw.io diagrams now live in docs/diagrams
@wiresage/mikrotik-mcp · 56 minutes ago
 2:01
A README edit no longer publishes a release
@wiresage/mikrotik-mcp · 1 hour ago
 2:28
MikroTik MCP can now sign in with an SSH agent key
@wiresage/mikrotik-mcp · 1 hour ago
 1:46
Read-only mode for MikroTik MCP: tools that can look but not change
@wiresage/mikrotik-mcp · 1 hour ago
 1:52
Sensitive-hiding mode keeps router secrets away from the model
@wiresage/mikrotik-mcp · 1 hour ago
 2:08
Safe Mode for MikroTik MCP: try a change, then keep it or drop it
@wiresage/mikrotik-mcp · 1 hour ago
 2:01
Migrating the MikroTik MCP server to mcp 2.0
@wiresage/mikrotik-mcp · 1 hour ago
 2:00
Pull request 47: the project moves from pip to uv
@wiresage/mikrotik-mcp · 1 hour ago
 1:33
Fleet article and multi-device prompt examples
@wiresage/mikrotik-mcp · 1 hour ago
 2:29
One MikroTik MCP server, many routers
@wiresage/mikrotik-mcp · 1 hour ago
 2:22
Escape quotes, backslashes, $ and non-ASCII in text sent to RouterOS
@wiresage/mikrotik-mcp · 1 hour ago
 1:58
Bridge VLAN table and port PVID tools for MikroTik MCP
@wiresage/mikrotik-mcp · 1 hour ago