Put a 3D model on a slide
Put a 3D model on a slide, declared in HTML.
three.js and anime.js in Bisque presentations
This fox is a real 3D model, drawn live on an ordinary slide. The slide names a file in its assets, and the player builds the scene, lights it, and keeps it turning. Bisque presentations can now carry a model like this, and move the markup you already wrote, from one JSON attribute each. Here is how both work, and one thing they still cannot do.
A model on the slide
1
A model on the slide.
First, the model.
One line puts a glTF file on the slide
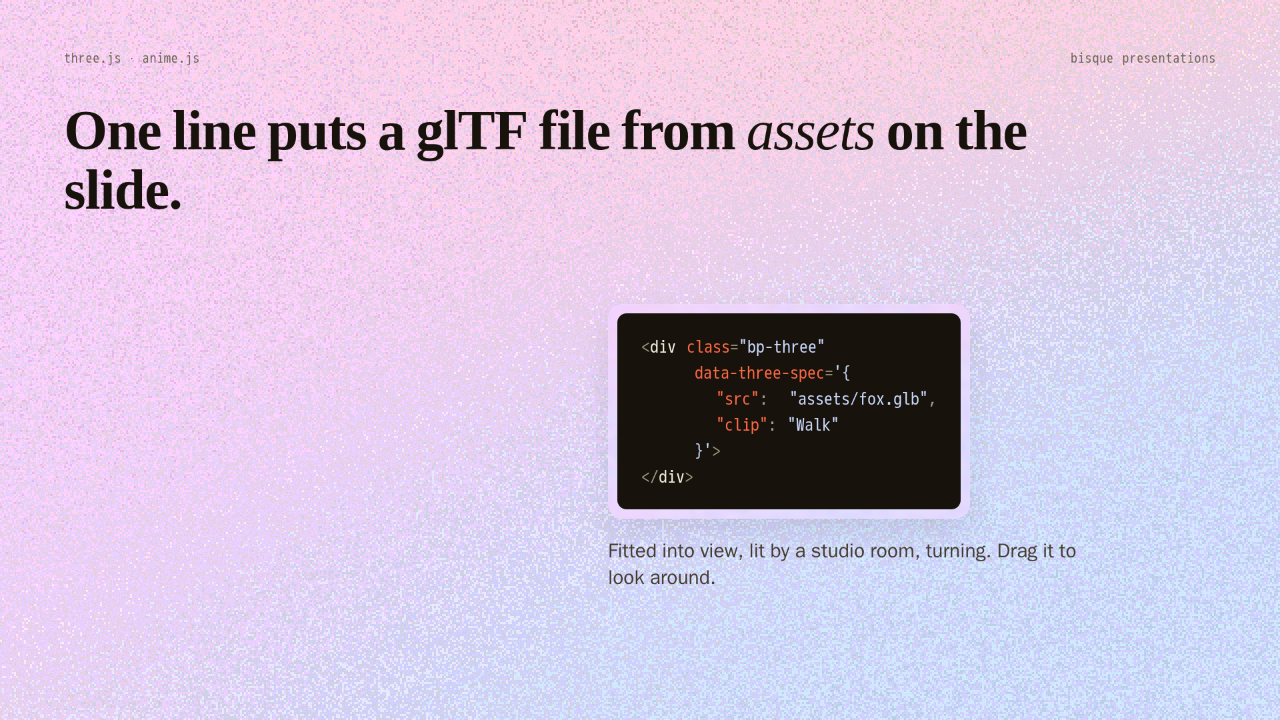
One line puts a glTF file from assets on the slide.
<div class="bp-three"
     data-three-spec='{
       "src":  "assets/fox.glb",
       "clip": "Walk"
     }'>
</div>
Fitted into view, lit by a studio room, turning. Drag it to look around.
The whole slide is this one element. It points at a glTF file in the presentation's assets, here a fox from the Khronos sample models, and names the animation clip to play. The player centers it, fits it into view, lights it with a studio room, and turns it slowly. Drag it and it orbits. One limit up front: it needs WebGL, so a very old TV draws an empty box instead.
Describe a shape, and it is built and lit
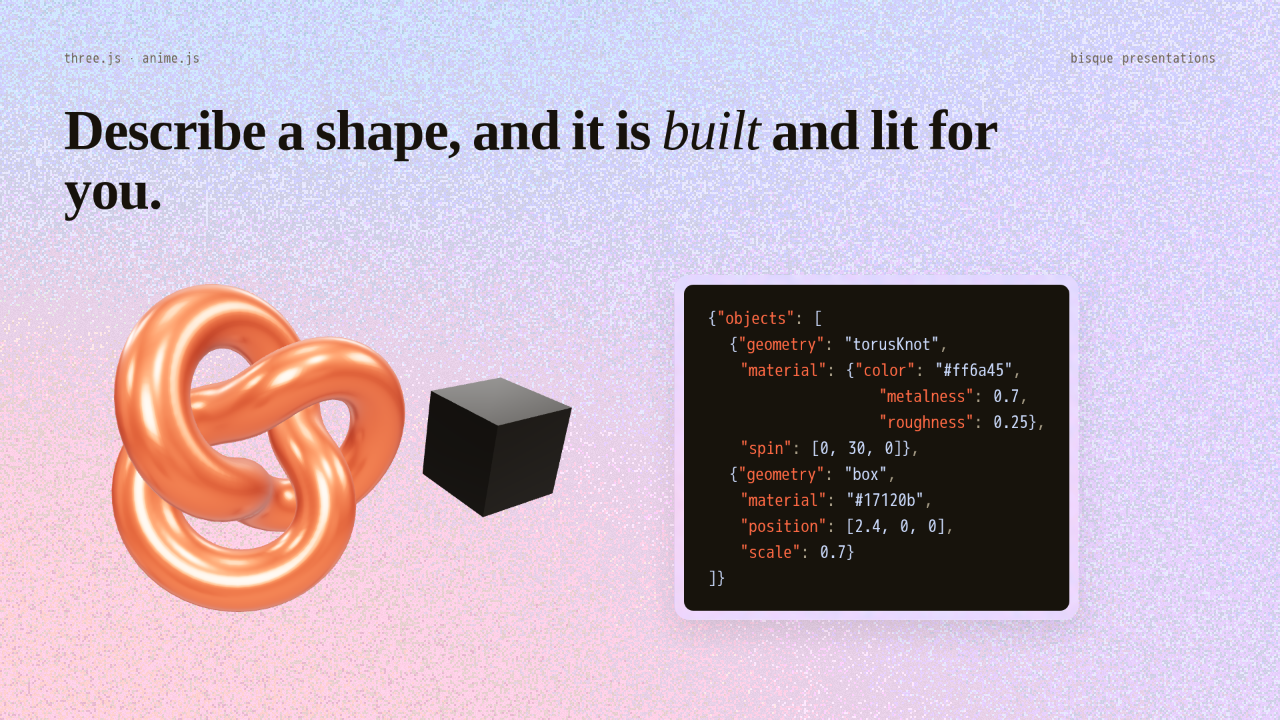
Describe a shape, and it is built and lit for you.
{"objects": [
  {"geometry": "torusKnot",
   "material": {"color": "#ff6a45",
                "metalness": 0.7,
                "roughness": 0.25},
   "spin": [0, 30, 0]},
  {"geometry": "box",
   "material": "#17120b",
   "position": [2.4, 0, 0],
   "scale": 0.7}
]}
A model is one way in. The other is to describe the objects yourself: a torus knot in coral metal, a cube beside it, each with a position, a material, and a spin in degrees per second. The player builds the geometry and the lighting from that description. That covers a diagram that wants depth, a product you can only sketch, or a shape the narration keeps pointing at.
Move what you wrote
2
Move what you wrote.
Then, the markup you already have.
Five bars grow in from one JSON attribute
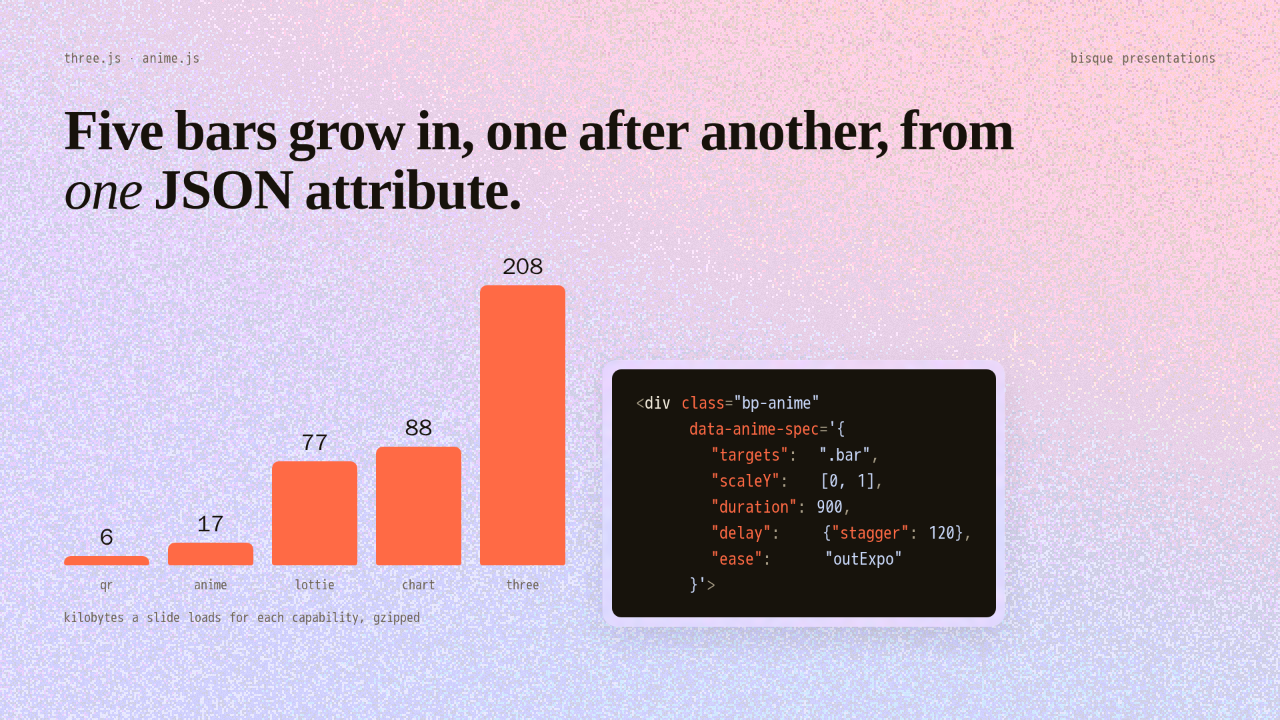
Five bars grow in, one after another, from one JSON attribute.
<div class="bp-anime"
     data-anime-spec='{
       "targets":  ".bar",
       "scaleY":   [0, 1],
       "duration": 900,
       "delay":    {"stagger": 120},
       "ease":     "outExpo"
     }'>
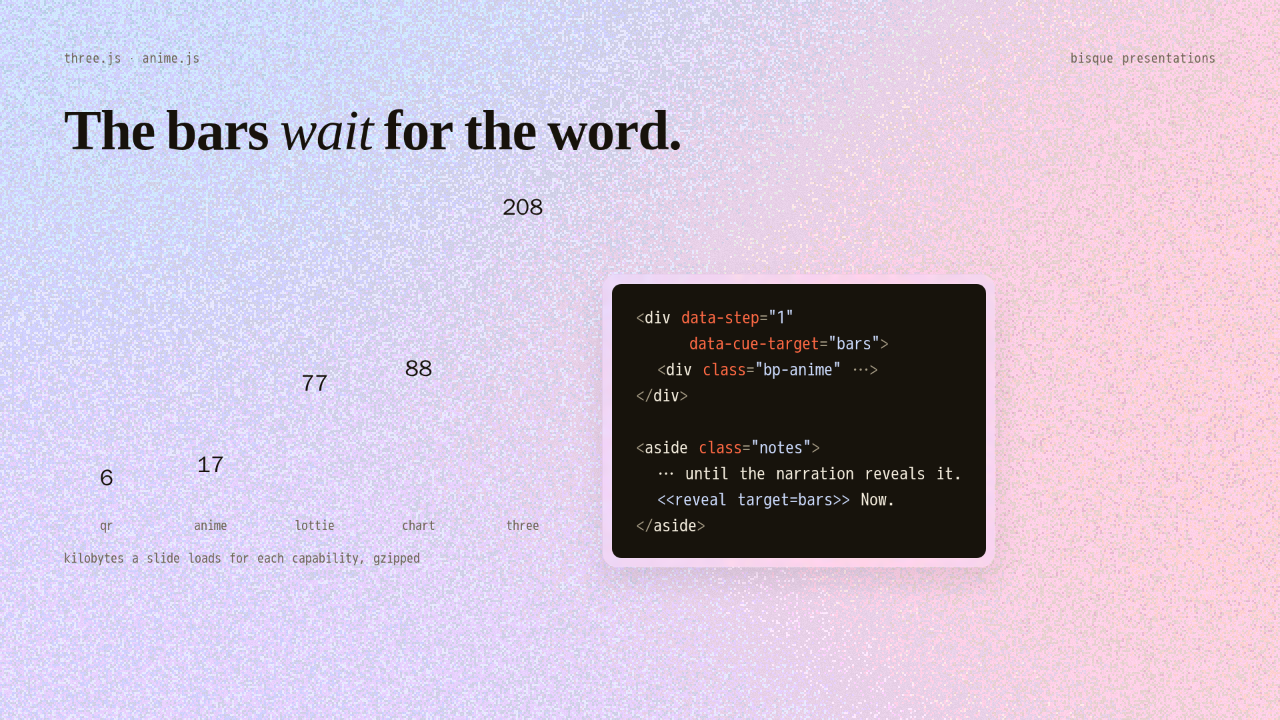
These bars are plain divs, and the numbers are what each capability costs a slide to load, gzipped. The anime.js bundle is about 17 kilobytes, and three.js about 210. The bars grow in one after another because the wrapper carries the parameters anime.js understands, written as JSON: a scale from zero to one, a stagger of 120 milliseconds, an ease that lands softly. The targets are a selector inside the wrapper, so a spec can only move what it wraps.
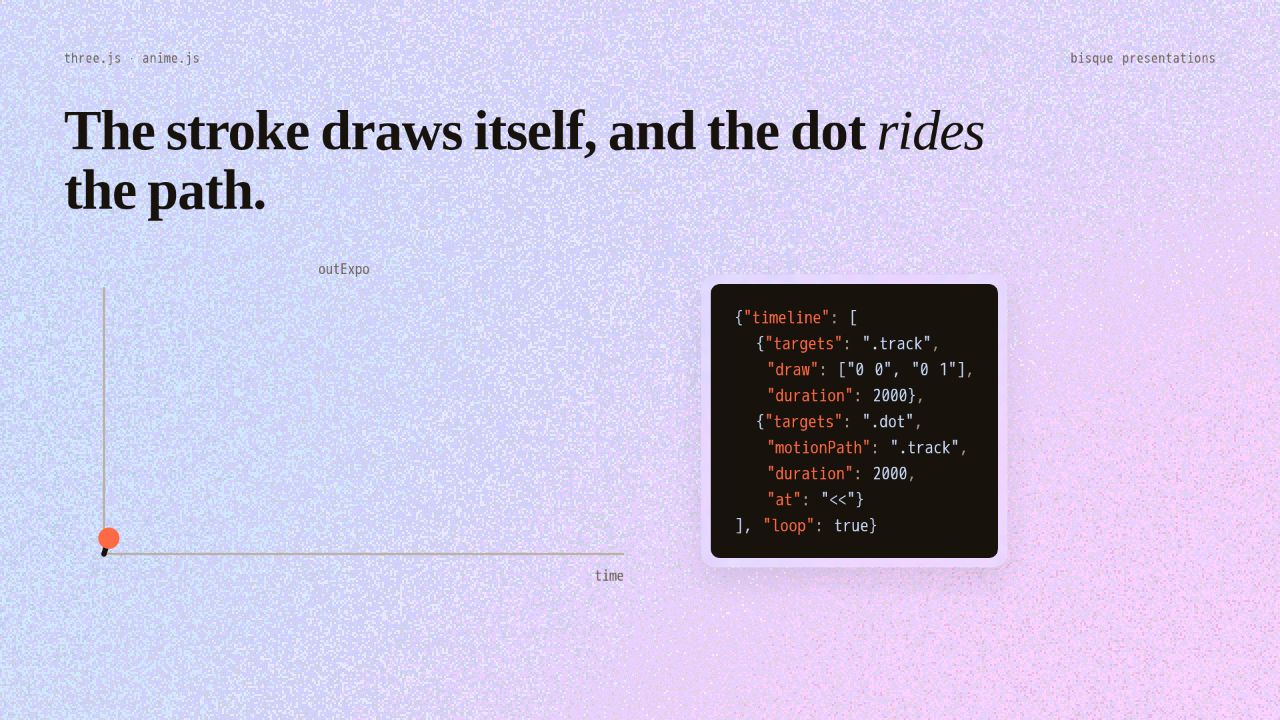
The stroke draws itself and the dot rides the path
The stroke draws itself, and the dot rides the path.
{"timeline": [
  {"targets": ".track",
   "draw": ["0 0", "0 1"],
   "duration": 2000},
  {"targets": ".dot",
   "motionPath": ".track",
   "duration": 2000,
   "at": "<<"}
], "loop": true}
This curve is the easing the bars just used, outExpo: fast at first, then settling. It is an inline SVG path, and two helpers animate it. Draw runs the stroke from nothing to its full length, and motion path moves the dot along the same curve, heading included. The two run together on one timeline, and the timeline loops.
The bars wait for the word
The bars wait for the word.
<div data-step="1"
     data-cue-target="bars">
  <div class="bp-anime" …>
</div>

<aside class="notes">
  … until the narration reveals it.
  <<reveal target=bars>> Now.
</aside>
Timing is what makes this a presentation and not a web page. Put the wrapper inside a step, and the animation holds its first frame until the narration reveals it. Now. The bars grew in on that word. If a viewer steps back, they rewind and wait for it again, and the export clock does the same, so the video lands on the same frame.
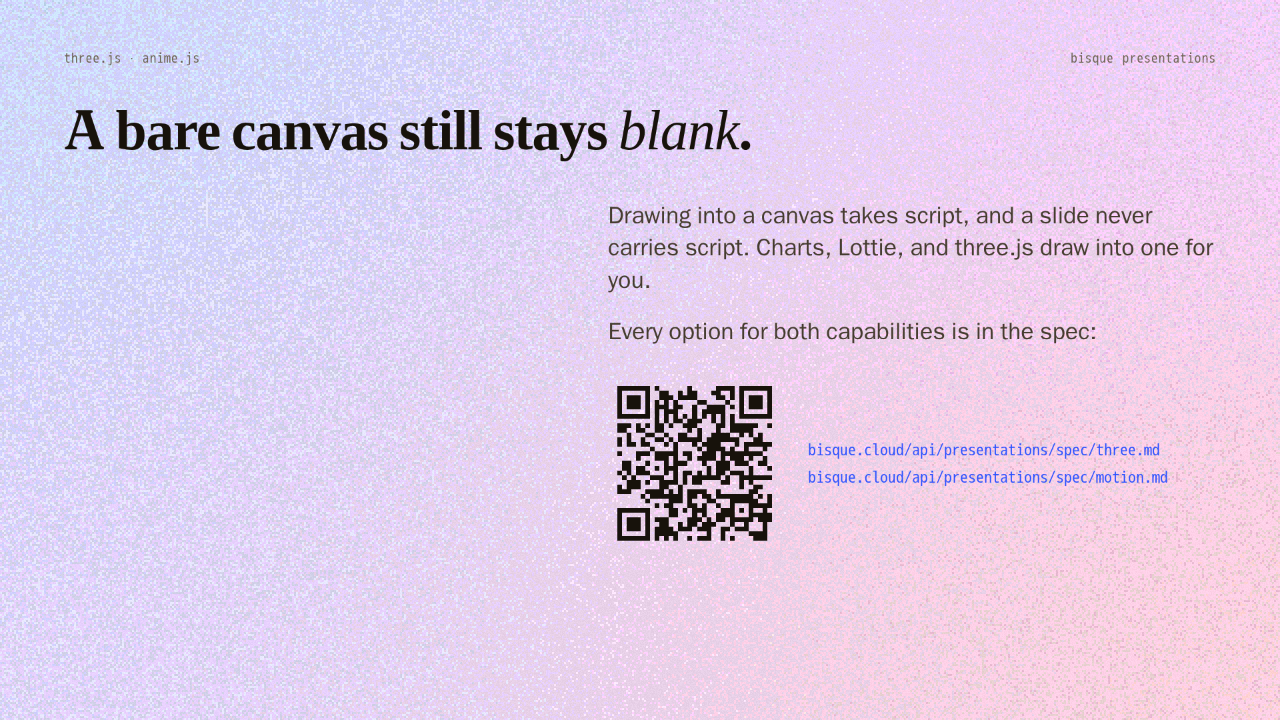
A bare canvas still stays blank
A bare canvas still stays blank.
Drawing into a canvas takes script, and a slide never carries script. Charts, Lottie, and three.js draw into one for you.
Every option for both capabilities is in the spec:
bisque.cloud/api/presentations/spec/motion.md
One thing this still does not do: a bare canvas element on a slide stays empty, because drawing into one takes script, and slides never carry script. Charts, Lottie, and three.js draw into one for you, and that is the limit. The fox from the first slide is still turning, built from one attribute, and every option for both capabilities is in the spec at the link on screen. Put a 3D model on a slide, declared in HTML.