They picked the learning rate before the run started
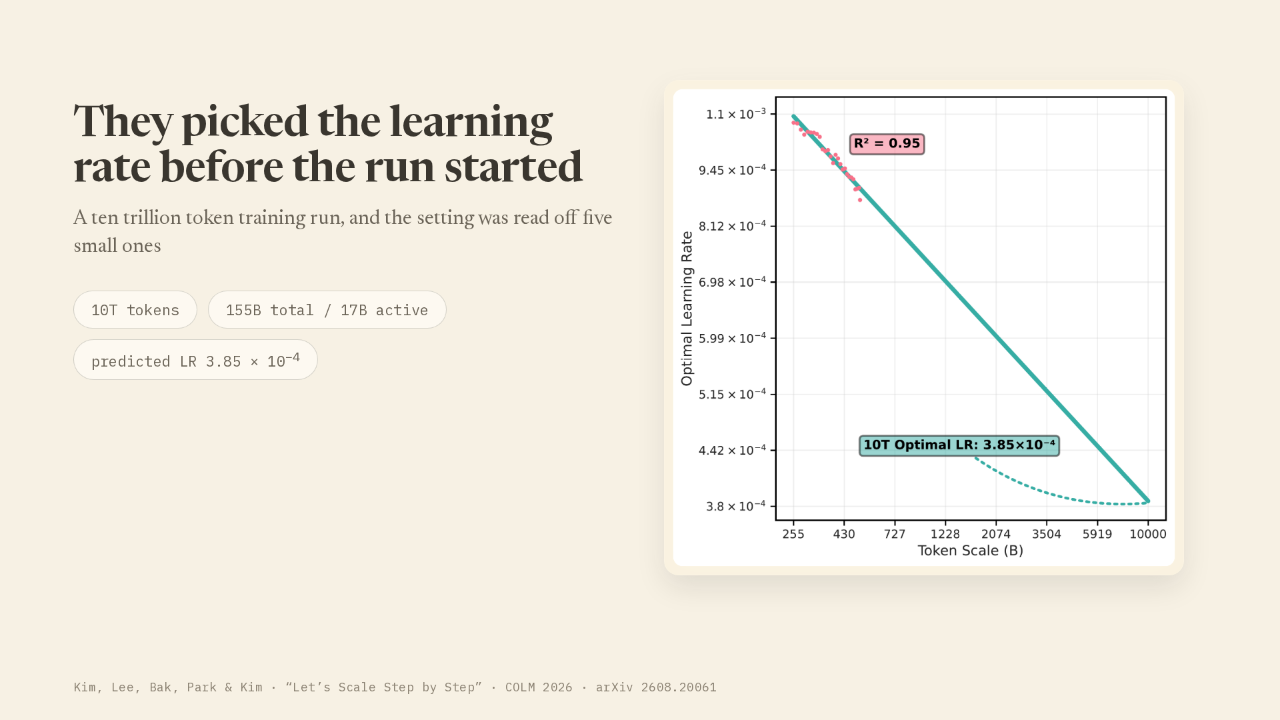
Training a large model gives you one attempt at its learning rate. That is the dial that sets how big a step the model takes each time it corrects itself. Set it too high and the run falls apart. Set it too low and the run crawls. This team picked that dial for a training run of ten trillion tokens, the pieces of text a model reads, before the run started. They read it off a line fitted to much smaller runs.
Two directions to search
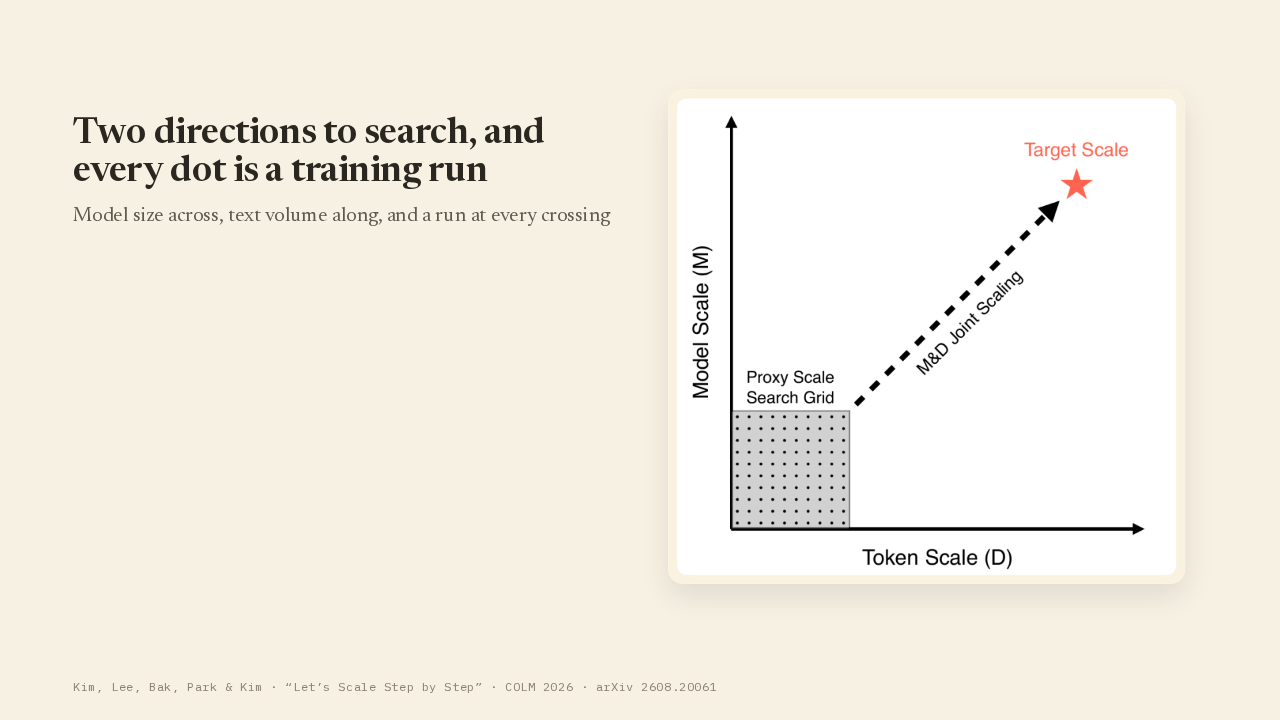
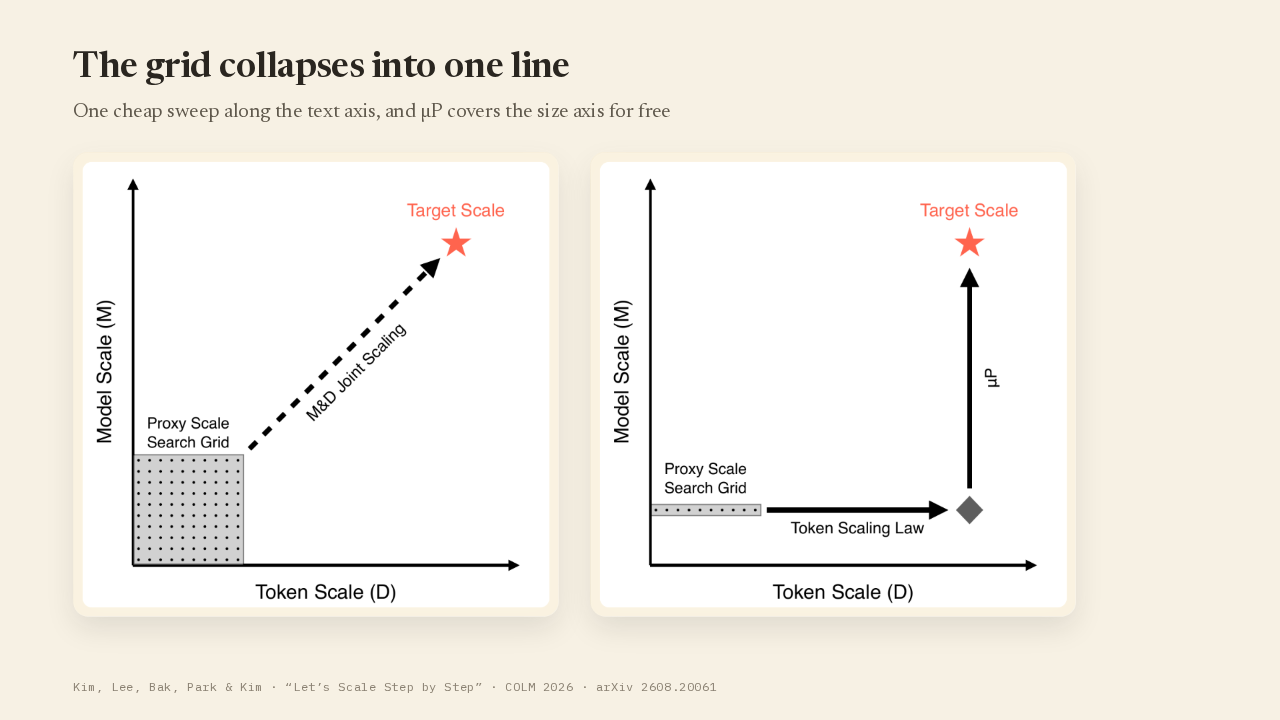
For a Mixture of Experts model, one split into many small sub networks with only a few of them running for any given word, the best learning rate found on a small model carries over to a model eight times wider. A second step then carries that setting from five hundred billion tokens out to ten trillion. Ordinarily a team searches both directions at once, on a grid where every dot is a training run somebody pays for.
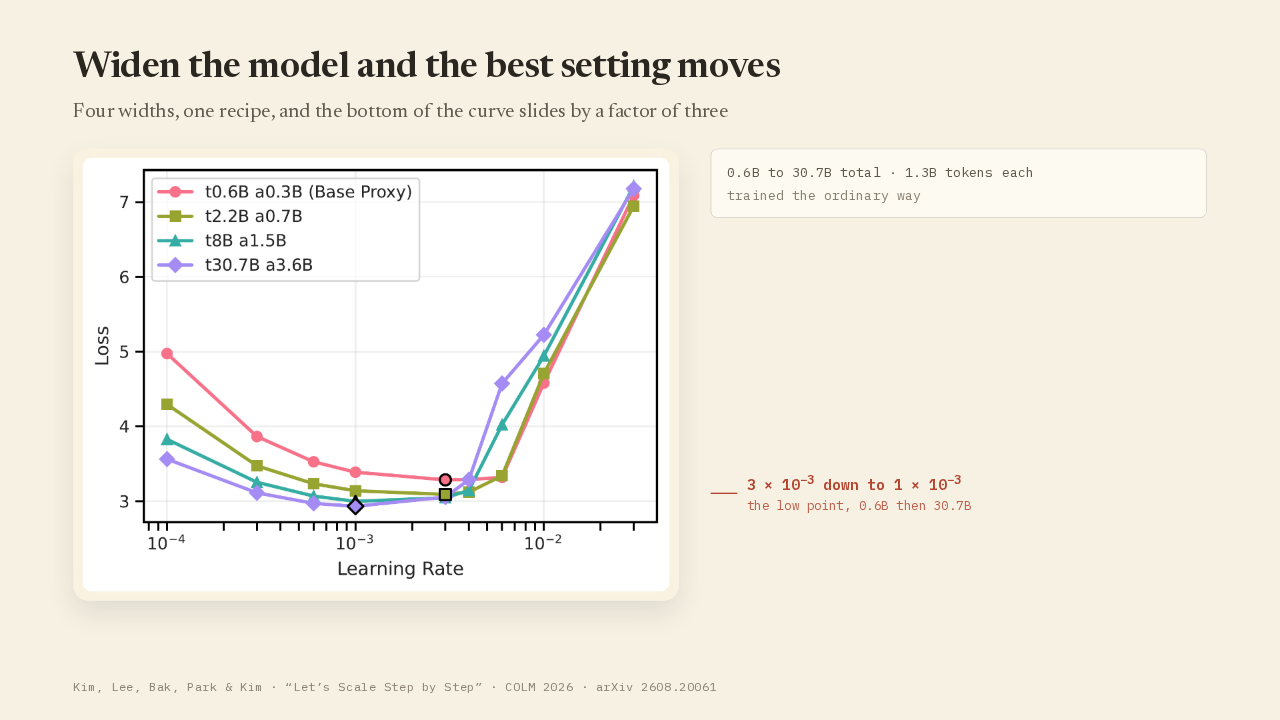
Widen the model and the best setting moves
trained the ordinary way
the low point, 0.6B then 30.7B
Plot how well a model trains against its learning rate and you get a U shaped curve: too small on the left, too big on the right, the best value at the bottom. Now set the model up the ordinary way and widen it. Width is how many numbers wide each layer is. The four models here run from six hundred million parameters to thirty point seven billion, each trained on one point three billion tokens. The bottom of the U does not stay put. The smallest model does best at three thousandths. By eight times the width, the best value has moved to one thousandth. So every new size has needed its own search: the setting from the small model is wrong on the big one.
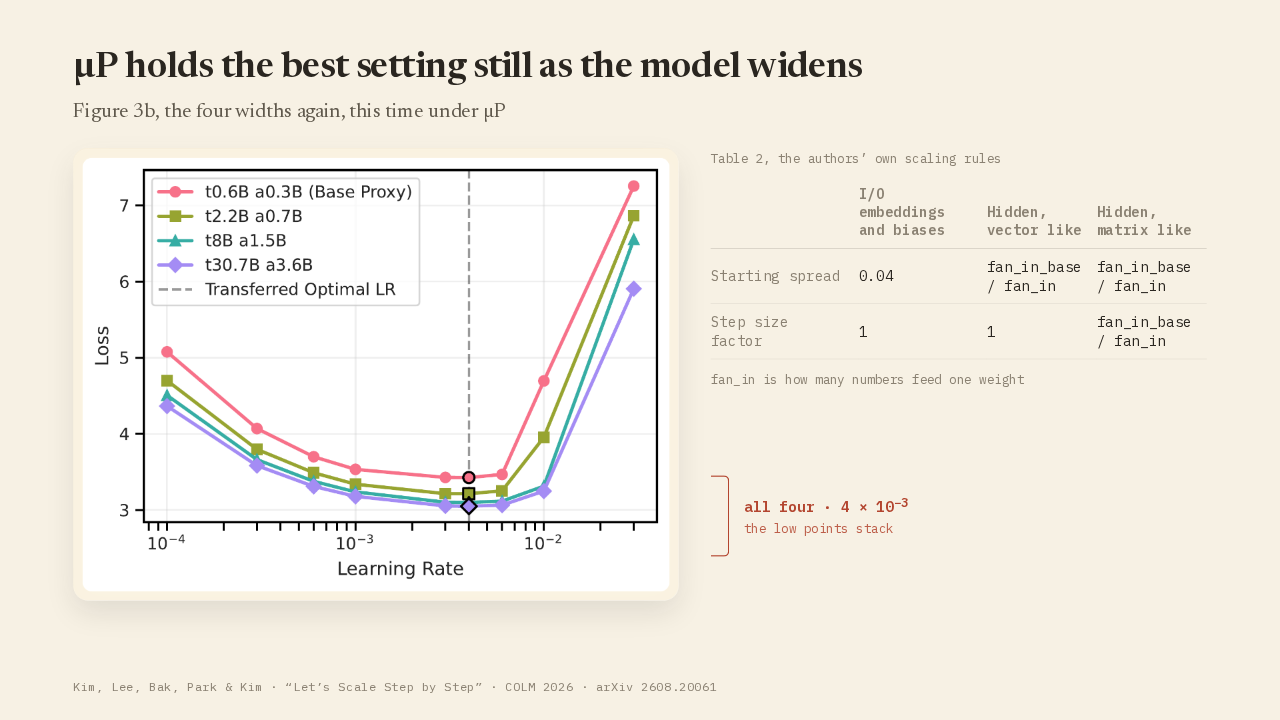
muP holds the best setting still as the model widens
| I/O embeddings and biases |
Hidden, vector like |
Hidden, matrix like |
|
|---|---|---|---|
| Starting spread | 0.04 | fan_in_base / fan_in |
fan_in_base / fan_in |
| Step size factor | 1 | 1 | fan_in_base / fan_in |
the low points stack
The sliding has a cause. As a layer gets wider, each weight update lands on a larger sum of inputs, so the same step size on the dial produces a bigger real change. The rule the authors use, called mu P, cancels that drift. It rescales every parameter's starting spread and its step size by how many inputs feed it, so an update stays the same size relative to what its layer puts out as the model widens. Pin that ratio and the U stops sliding. Same four models, same sweep, one rule changed, and all four low points land on four thousandths. You would expect a wider model to want a different dial. It turns out the dial only moved because that ratio was drifting.
The grid collapses into one line
Width is only half of it. The best learning rate also drifts as the model trains on more text, and the drift runs downward. What makes that usable is its shape. Stretch both axes so each step multiplies instead of adds, and the drift is a straight line. So the grid collapses into two cheap moves. At the small size, fit a line across a range of token budgets and walk it out as far as you are willing to go. Then mu P carries that result up to the target width for free.
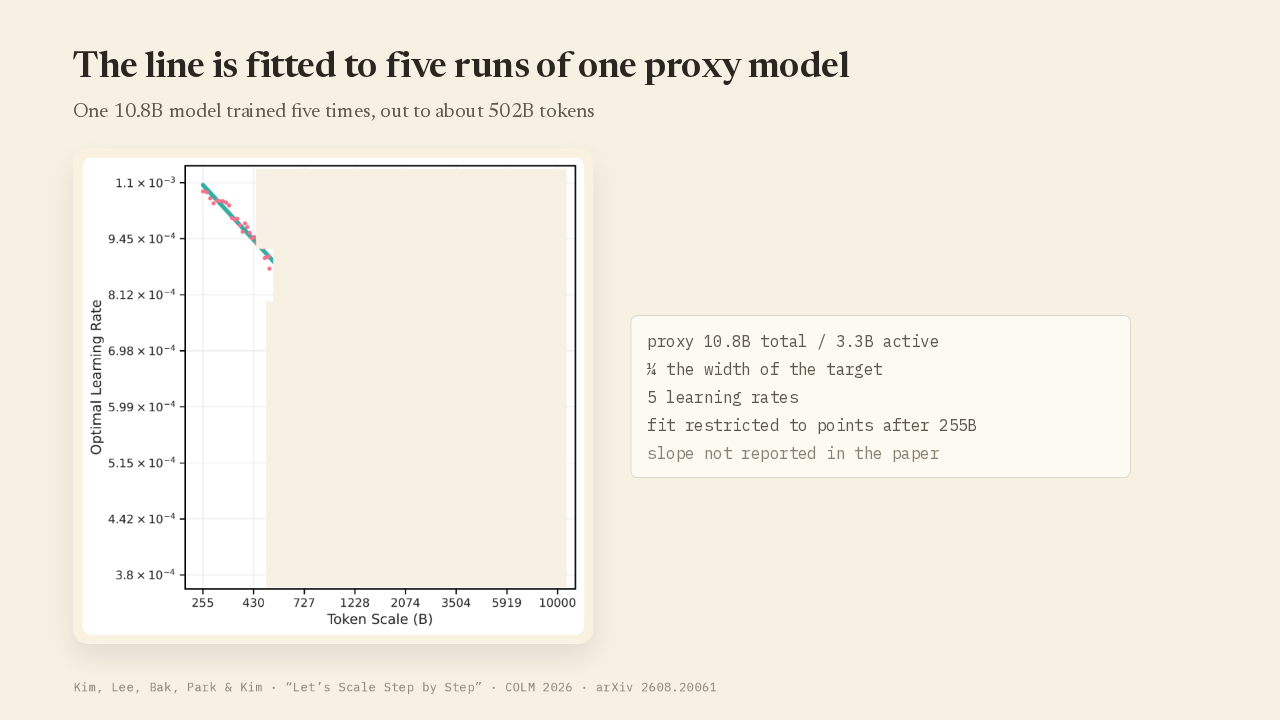
The line is fitted to five runs of one proxy model
¼ the width of the target
5 learning rates
fit restricted to points after 255B
slope not reported in the paper
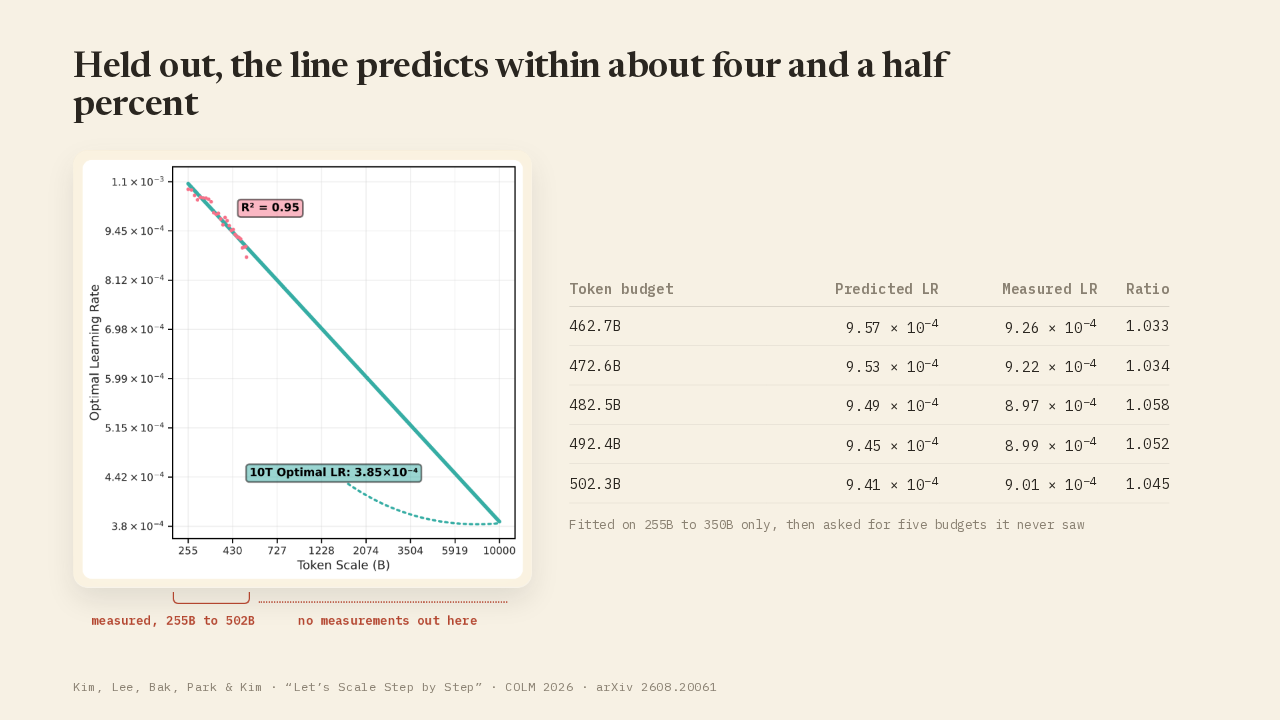
The line is fitted to one model. A proxy at ten point eight billion parameters, a quarter the width of the target, trained five times over, at five different learning rates, out to about five hundred billion tokens. The team reads the best setting off those runs every ten billion tokens along the way. That turns five runs into a couple of dozen measurements. The fit uses only the measurements after two hundred and fifty five billion tokens.
Held out, the line predicts within about four and a half percent
| Token budget | Predicted LR | Measured LR | Ratio |
|---|---|---|---|
| 462.7B | 9.57 × 10⁻⁴ | 9.26 × 10⁻⁴ | 1.033 |
| 472.6B | 9.53 × 10⁻⁴ | 9.22 × 10⁻⁴ | 1.034 |
| 482.5B | 9.49 × 10⁻⁴ | 8.97 × 10⁻⁴ | 1.058 |
| 492.4B | 9.45 × 10⁻⁴ | 8.99 × 10⁻⁴ | 1.052 |
| 502.3B | 9.41 × 10⁻⁴ | 9.01 × 10⁻⁴ | 1.045 |
Extended to ten trillion tokens, the line reads three point eight five times ten to the minus four, a bit under four ten thousandths, and it fits its own points closely. The stronger check is in the appendix. The team refit the line using only the earliest stretch, two hundred and fifty five to three hundred and fifty billion tokens, then predicted five later budgets it had never seen. Those predictions come in between three and six percent off the measured values, averaging about four and a half percent.
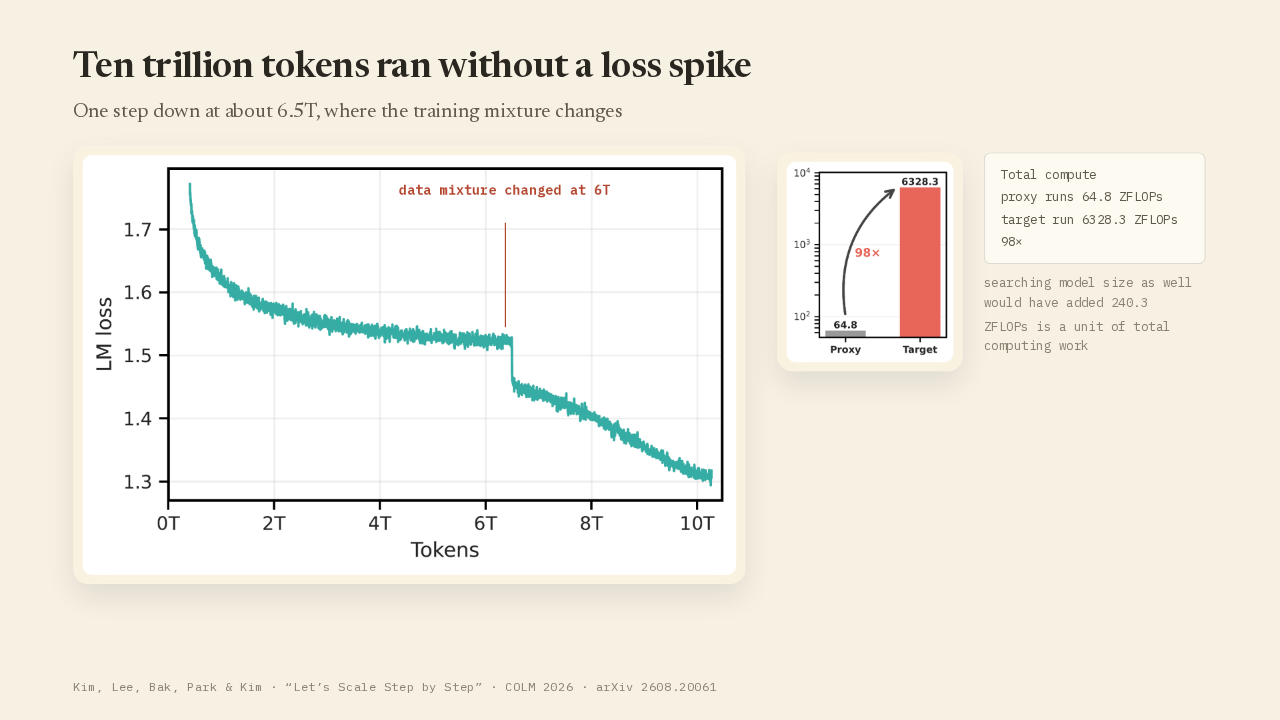
Ten trillion tokens ran without a loss spike

proxy runs 64.8 ZFLOPs
target run 6328.3 ZFLOPs
98×
Then they used the number. A Mixture of Experts model, a hundred and fifty five billion parameters, seventeen billion of them active for any given word, trained from scratch on ten trillion tokens. The loss, how wrong the model is on each next word, falls from about one point eight to about one point three, with no spikes anywhere. The one step down in the middle is the day the team changed the training mixture, not the model coming apart. The finished model scores competitively on the benchmarks. The five small runs behind the prediction cost about a ninety eighth of the ten trillion token run.
Stability is the evidence, not optimality
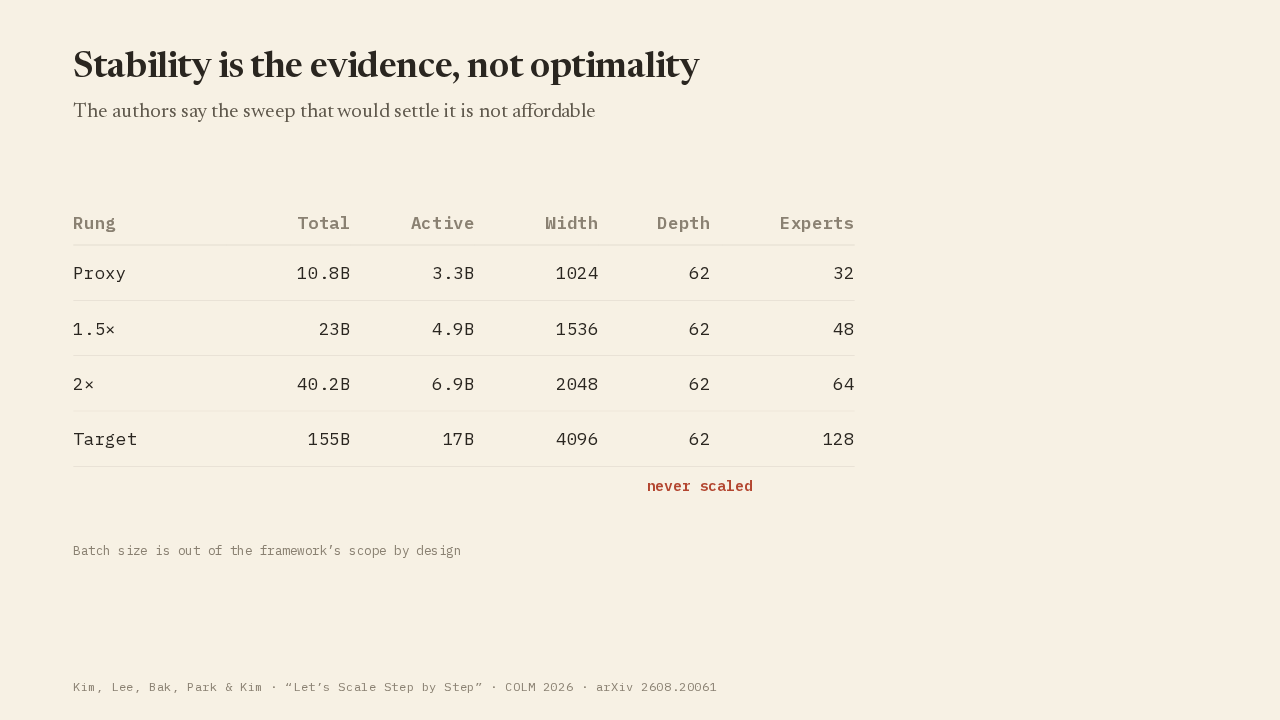
The fitted range stops at five hundred billion tokens and the prediction is for ten trillion. That is about twenty times further than the furthest measured point. The held out check validated a reach of about one and a half. In their own conclusion the authors say it plainly: full scale sweeps to verify that the predicted setting really is the best one are not affordable. So the evidence is a run that went well. Whether it went best was never measured. Every rung of the ladder from the proxy to the target is sixty two layers deep, so depth is untested. The models get wider and add experts together, so those two effects cannot be told apart. And all of it runs on one attention design, MLA, which squeezes the model's stored memory into a much smaller form, and one optimizer, Muon, the rule that decides how each update is applied.
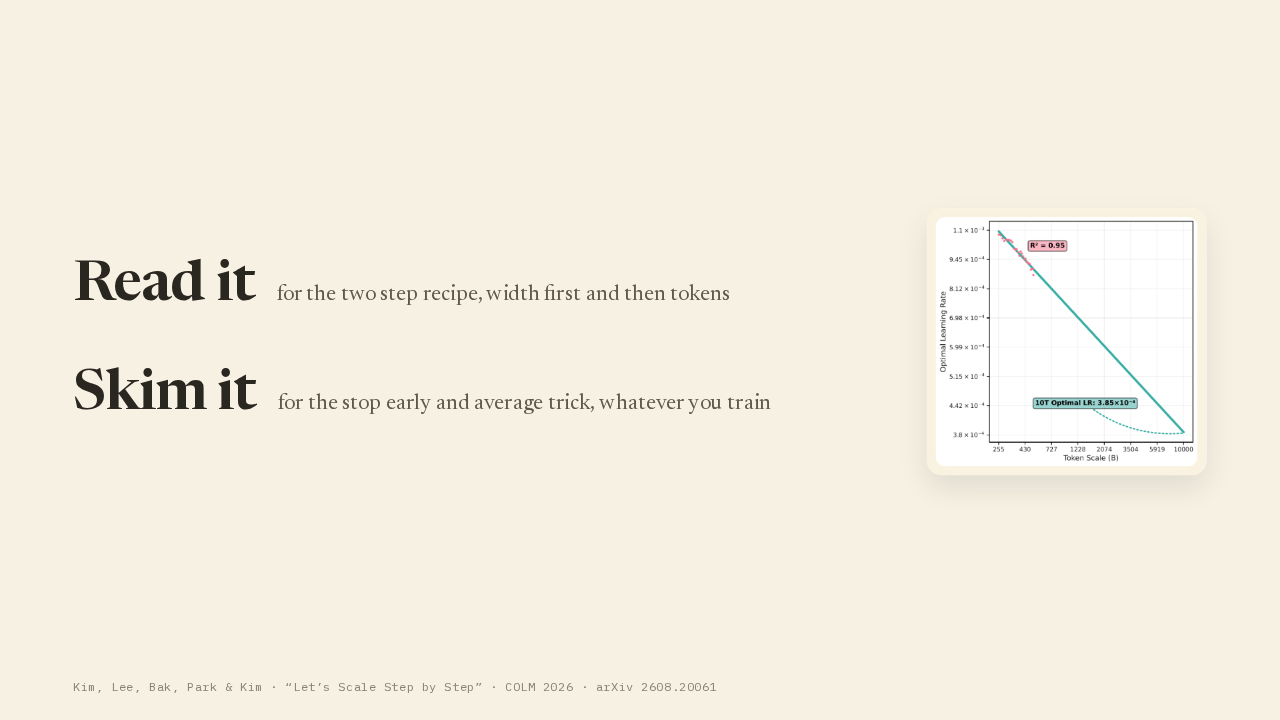
Read it if you train these. Skim it for the trick.
Read it if you train or plan Mixture of Experts runs. It is the clearest account of how to spend a small budget on a number you get one shot at. Skim it otherwise, for one trick that has nothing to do with the model's design. To get measurement points cheaply, the team stops the small runs early and averages the model's numbers over the last stretch instead of finishing each run properly. That turns one training run into a measurement at every point along the way, and any team fitting a curve over token budgets can use it.
Kim, Lee, Bak, Park and Kim, COLM 2026
“Let’s Scale Step by Step”
COLM 2026 · arXiv 2608.20061
Kim, Lee, Bak, Park and Kim, at Kakao and Upstage. Let's Scale Step by Step, COLM twenty twenty six, arXiv two six zero eight point two zero zero six one.