Login tickets rose 40% because one release broke Google sign-in
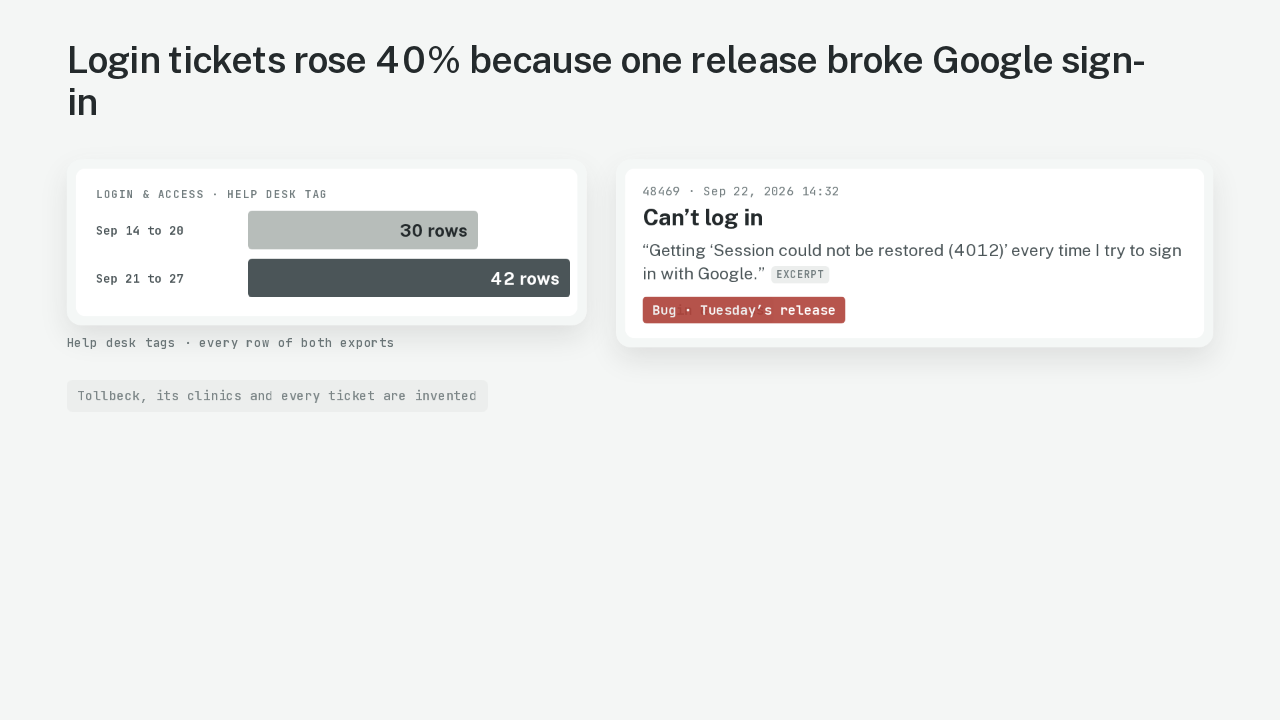
Login tickets at Tollbeck are up forty percent. Thirteen of those tickets are one release bug. I gave Claude Docs two weeks of tickets from Tollbeck, a booking app for small clinics, and asked for the trends note. Claude Docs is Anthropic's new document editor inside Claude. You attach files and ask, and Claude writes a doc you can edit. If you lead a support team, you send this note to product and engineering every Monday. The note says what drove last week's tickets, what changed since the week before, and which tickets prove it. I made up Tollbeck, its clinics and every ticket.
Anthropic’s triage guide files a login failure caused by a bug under Bug
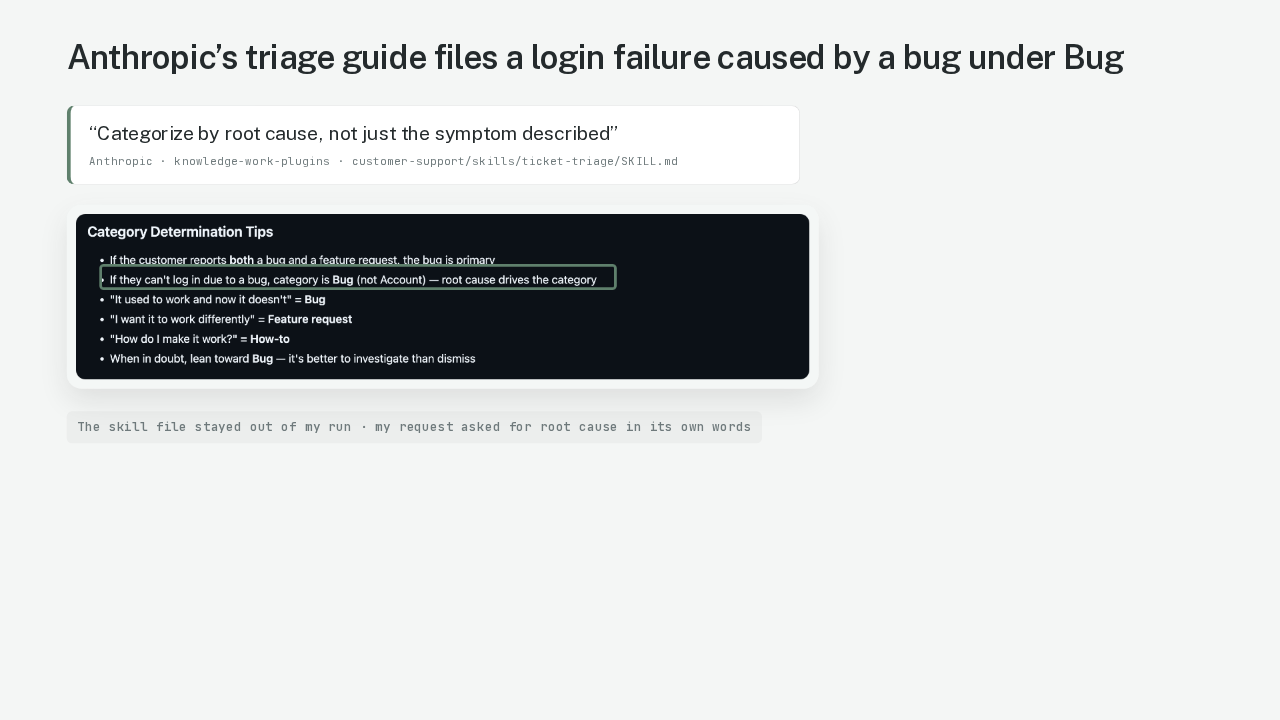
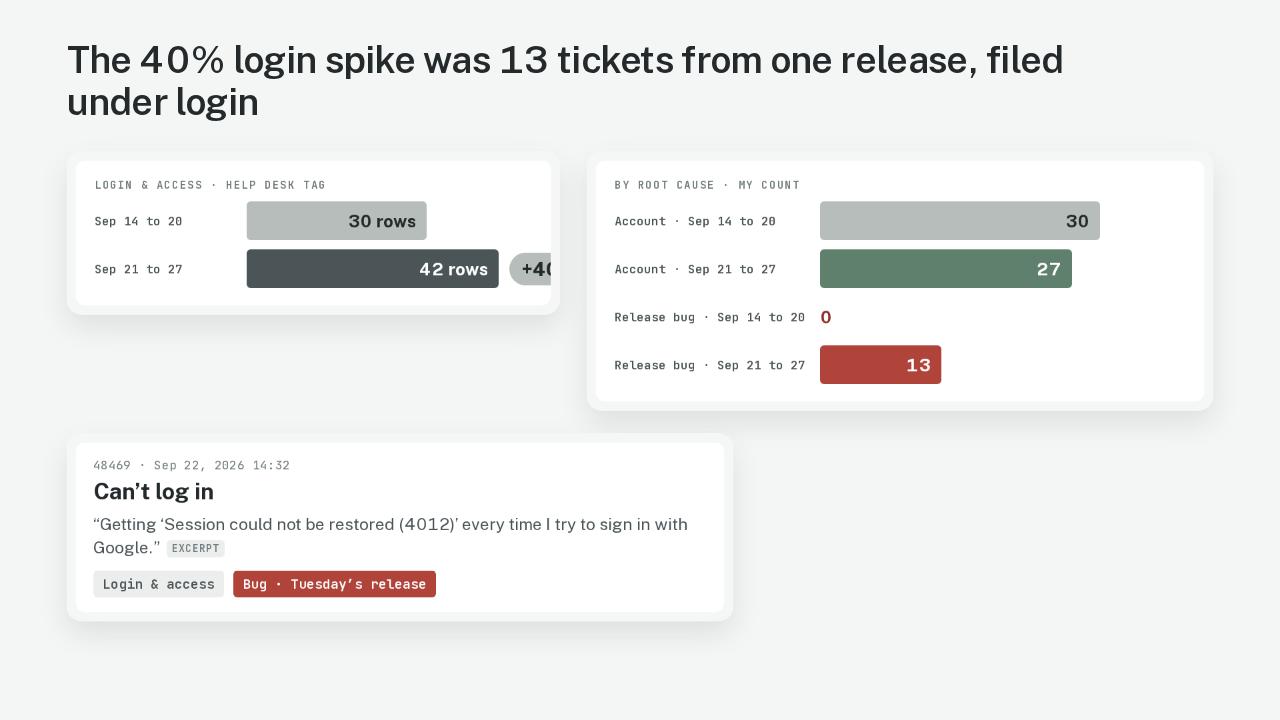
A help desk agent tags each ticket by what the customer typed, so a login loop goes under login. Anthropic publishes skill files, written instructions Claude can follow for one kind of task. Anthropic's ticket triage file for support teams says to tag by root cause. Root cause means what actually broke. The file's own example is a customer who can't log in because of a bug. That ticket counts as a bug. Tag by what customers typed, and a bad release looks like a login spike on the account team's desk. The skill file stayed out of my run. I asked for root cause in my own words.
Ten tickets titled “Can’t log in” have three different causes
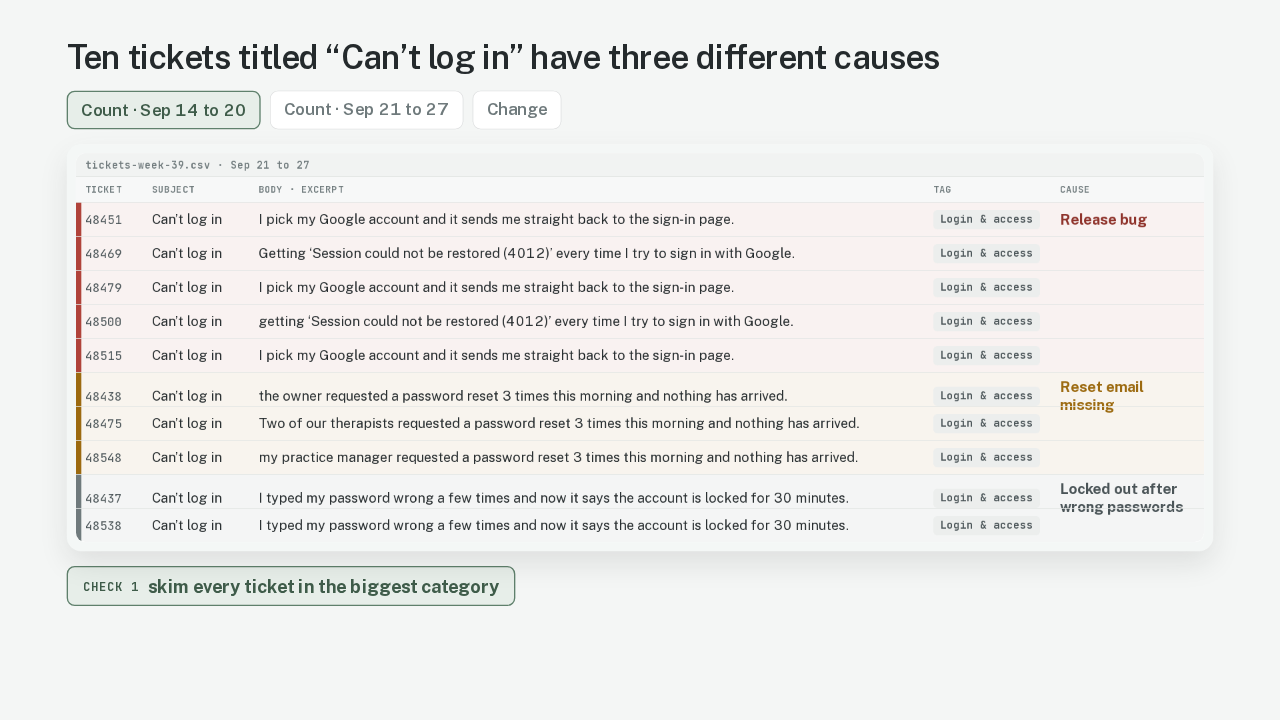
A trends note is three numbers per category. There's the count for the week before, the count for last week, and the change between them. Each of the three numbers can go wrong in its own way. The first way is the tag. Ten of last week's tickets share one subject line, can't log in. Five of those ten tickets are the release bug. Three are password reset emails that never arrived. Two are customers who typed a wrong password and got locked out. Sort by subject line, and all ten tickets land in one pile. So the first check is to skim every ticket in the biggest category. The three example tickets a note cites can all look right, so read the whole pile.
A renamed tag and six merged rows change the counts before any math
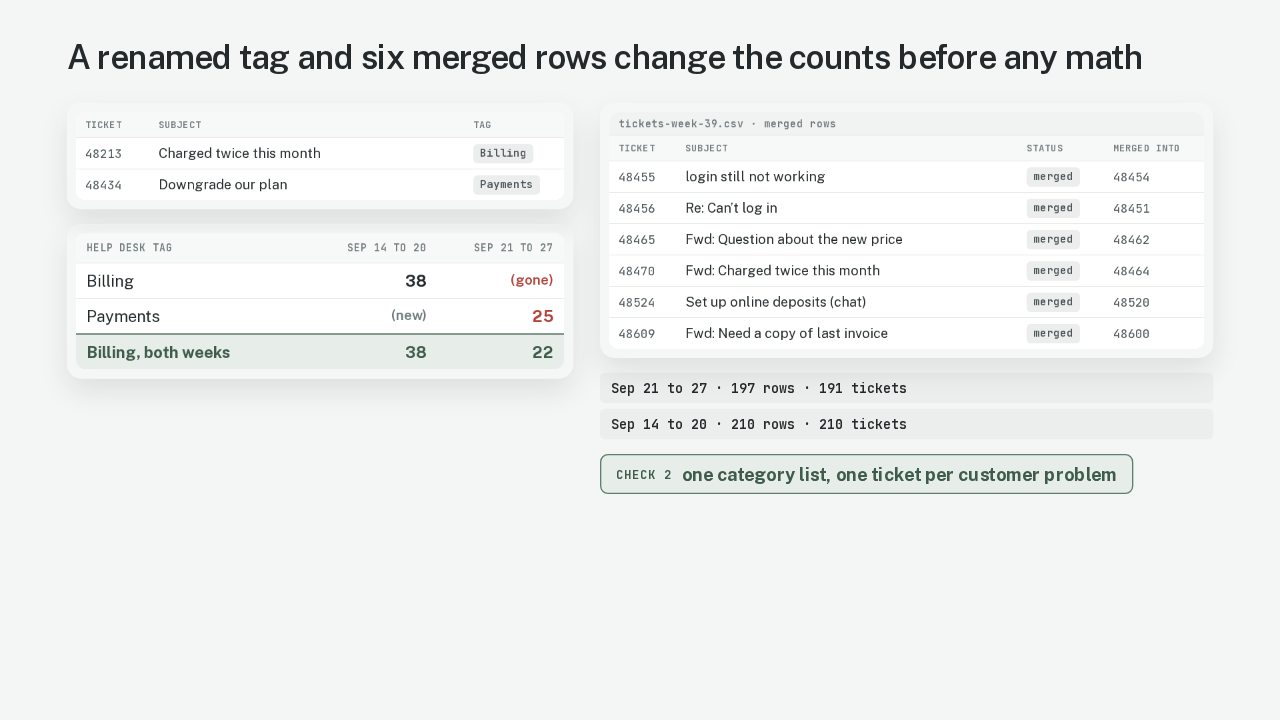
The second check is the category list. Tollbeck's help desk renamed its Billing tag to Payments between the two weeks. Go by the help desk's tags, and Billing disappears while Payments shows up new with twenty-five rows. Put both weeks on one list, and billing tickets fell from thirty-eight to twenty-two. The same check covers duplicates. When a customer writes twice, the help desk merges the follow-up into the first ticket. All six merged rows sit in last week's file. So last week's file holds a hundred and ninety-seven rows but only a hundred and ninety-one tickets.
A smaller week makes a shrinking category look like it is growing
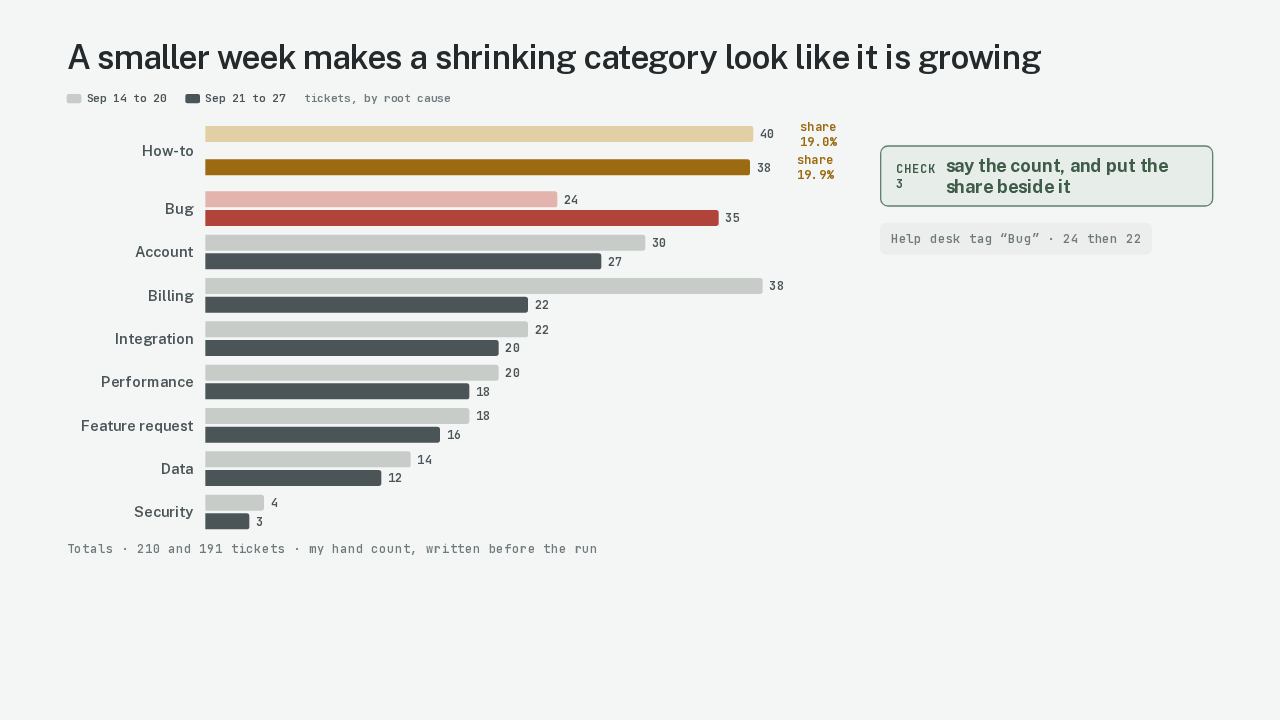
The third check is the change itself. How-to questions went from forty tickets to thirty-eight. Last week had fewer tickets overall, a hundred and ninety-one against two hundred and ten. So the how-to slice of the total grew, from nineteen percent to almost twenty. A note that calls how-to a growing problem is reading the slice. Say the count, and give the share only with the count beside it. Counted by root cause, the real rise is bugs, from twenty-four tickets to thirty-five. The help desk's own bug tag went down, from twenty-four to twenty-two.
Both exports go in with one request for root-cause tags and one list
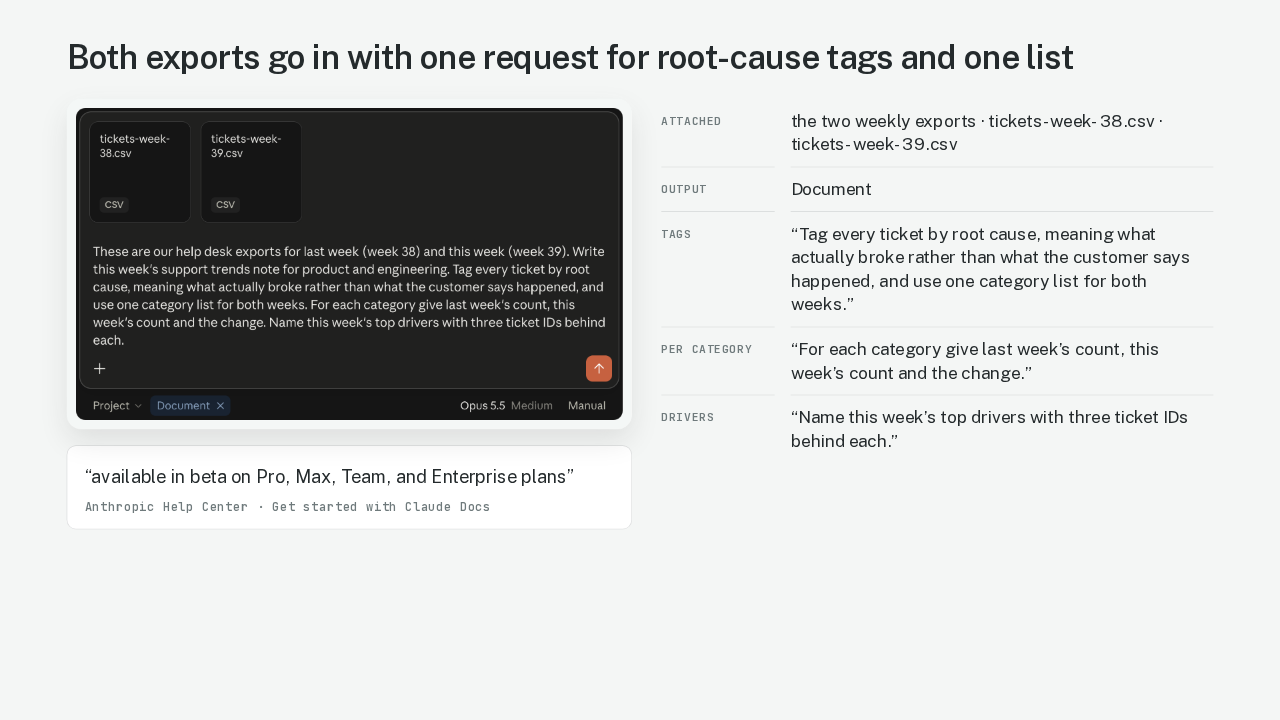
In Claude, I attached both exports as CSV files, a plain spreadsheet format. Then I opened the Output menu and picked Document. My request asked Claude to sort by what broke, on a single set of categories for both weeks. The request also asked for both counts and the change for every category, and three ticket numbers behind each top driver. My request left out the rename, the merged rows and the release. Claude Docs is in beta, an early release, on Claude's Pro, Max, Team and Enterprise plans.
Claude Docs split the “Can’t log in” tickets and caught the renamed tag
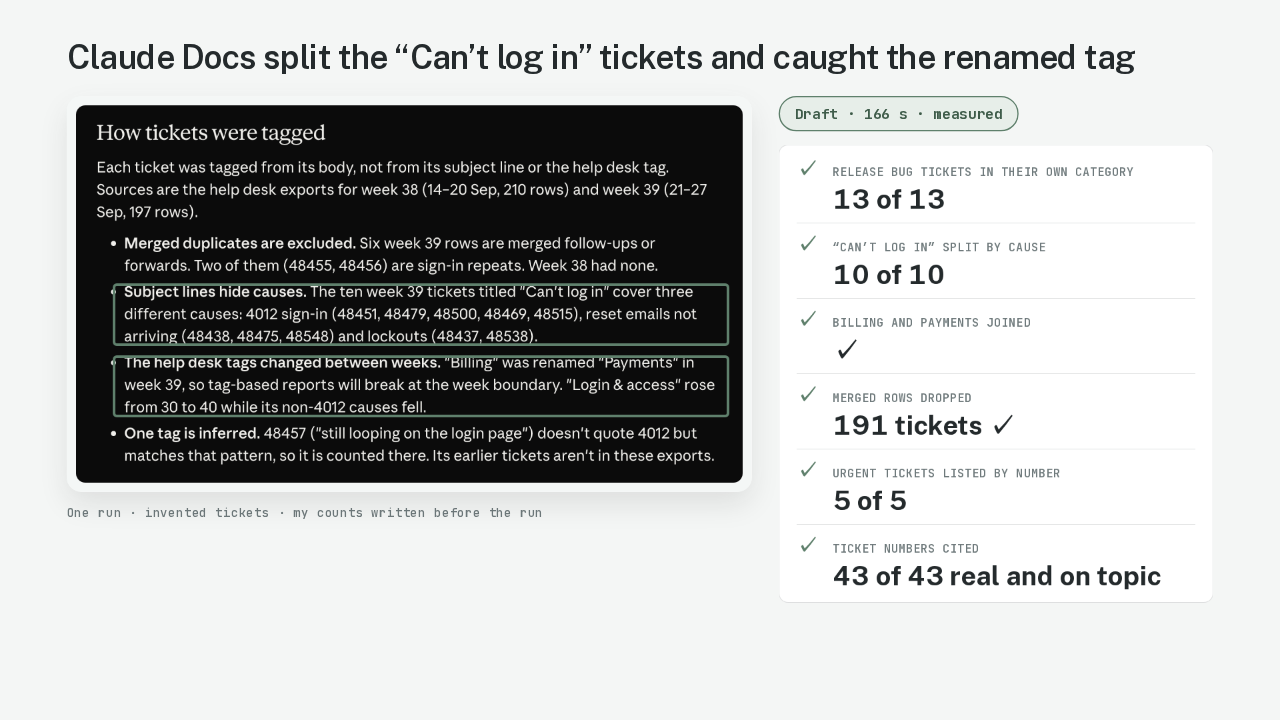
The draft took a hundred and sixty-six seconds, by the conversation's timestamps. Before the run, I wrote down the right count for every category. Claude gave all thirteen release bug tickets a sign-in category of their own. The doc sorts the ten can't log in tickets into their three causes and says so. Claude joined Billing to Payments, dropped the six merged rows and counted a hundred and ninety-one tickets. Claude listed all five urgent tickets, and all forty-three ticket numbers in the doc point at the right tickets.
Claude Docs misfiled 17 data tickets and inflated its second-biggest driver
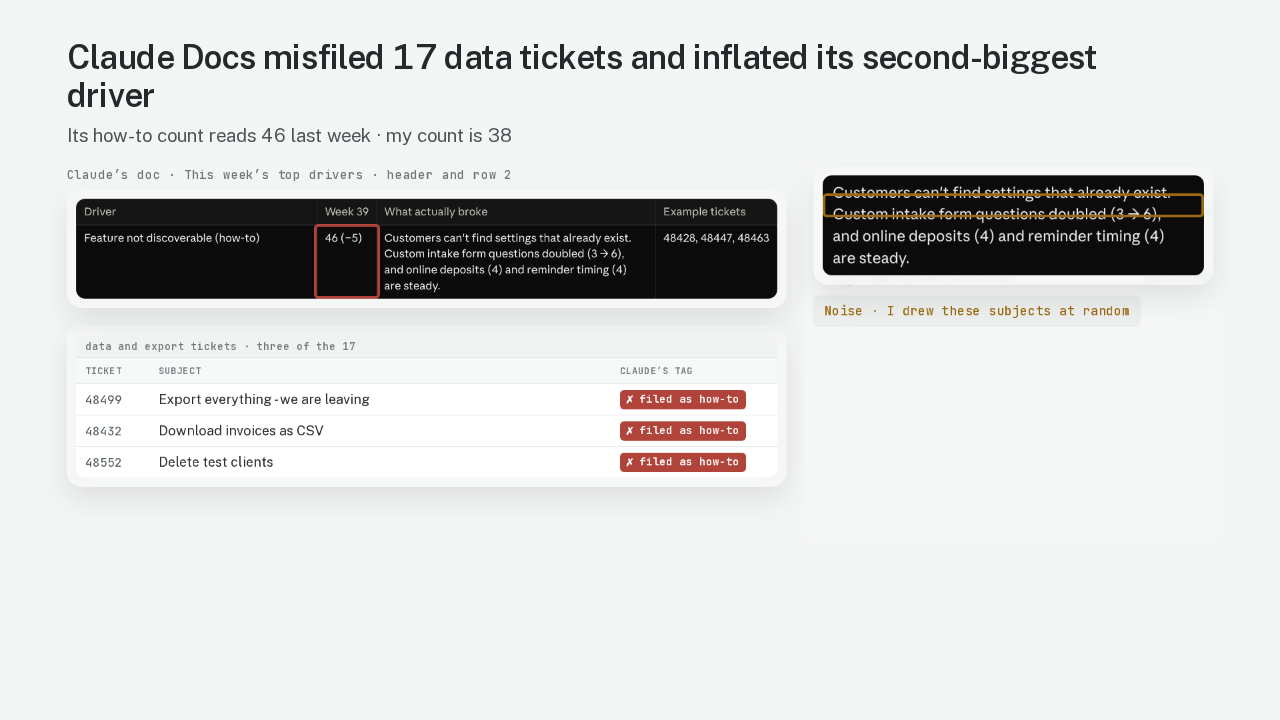
On my run, Claude got one category wrong. The doc says each ticket was tagged from its body. Claude's tagging program read the subject line first, and any ticket it couldn't match became a how-to question. Seventeen data and export tickets across the two weeks went that way. So the doc's second biggest driver, customers who can't find a setting, shows forty-six tickets last week against my thirty-eight. One of those seventeen is a clinic asking to export everything before it cancels. The three tickets the doc cites for that driver are genuine, so only the skim from check one finds the problem. The doc also says custom intake form questions doubled, from three tickets to six. I picked those subjects at random, so that move is noise.
Claude’s doc ranks the drivers, and you decide which one gets engineering time
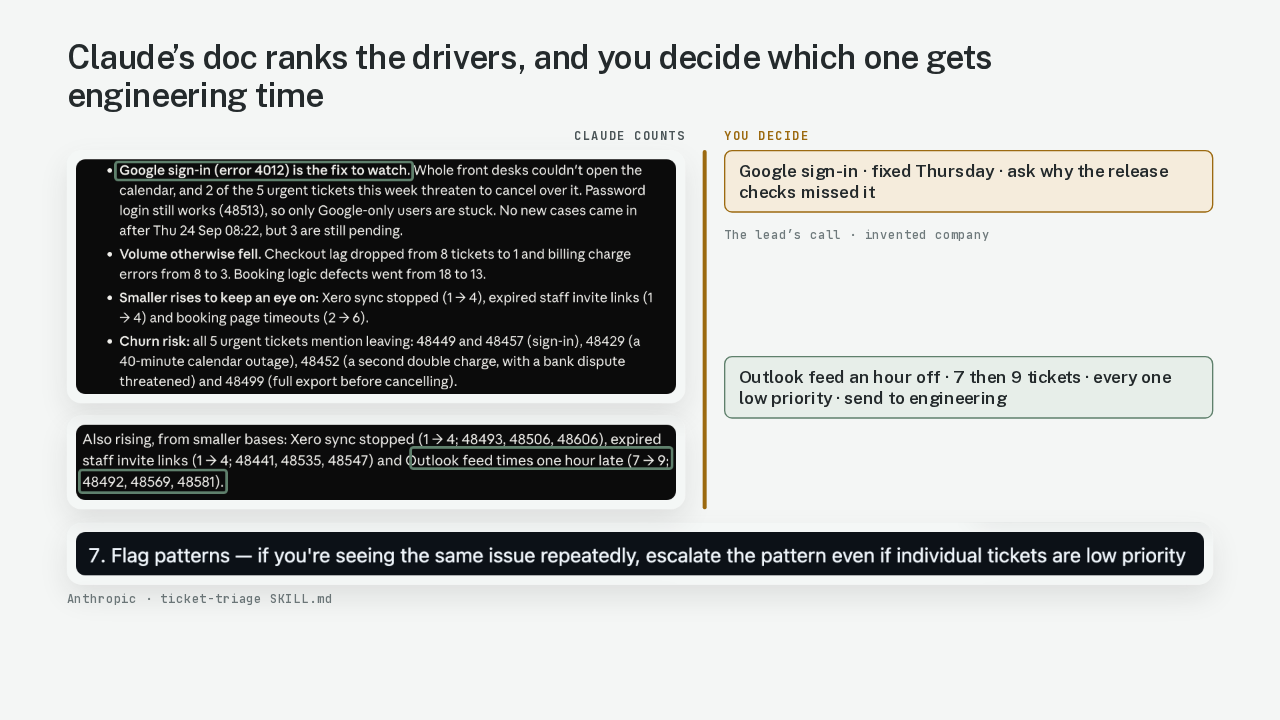
Here is where I'd stop and read it myself. Claude calls the Google sign-in bug the fix to watch. Tollbeck's engineers shipped a fix on Thursday, and the last sign-in ticket came in that morning. So I'd ask why the release checks missed Google sign-in, and move on. The doc lists an Outlook problem under also rising, from seven tickets the week before to nine. Every appointment shows up an hour off in the Outlook calendar. That's sixteen tickets in two weeks, each one marked low priority. Anthropic's triage file says to escalate a repeating pattern even when each ticket is low priority. I'd put the Outlook bug in front of engineering today.
Five customers threatened to cancel, and you read each ticket yourself
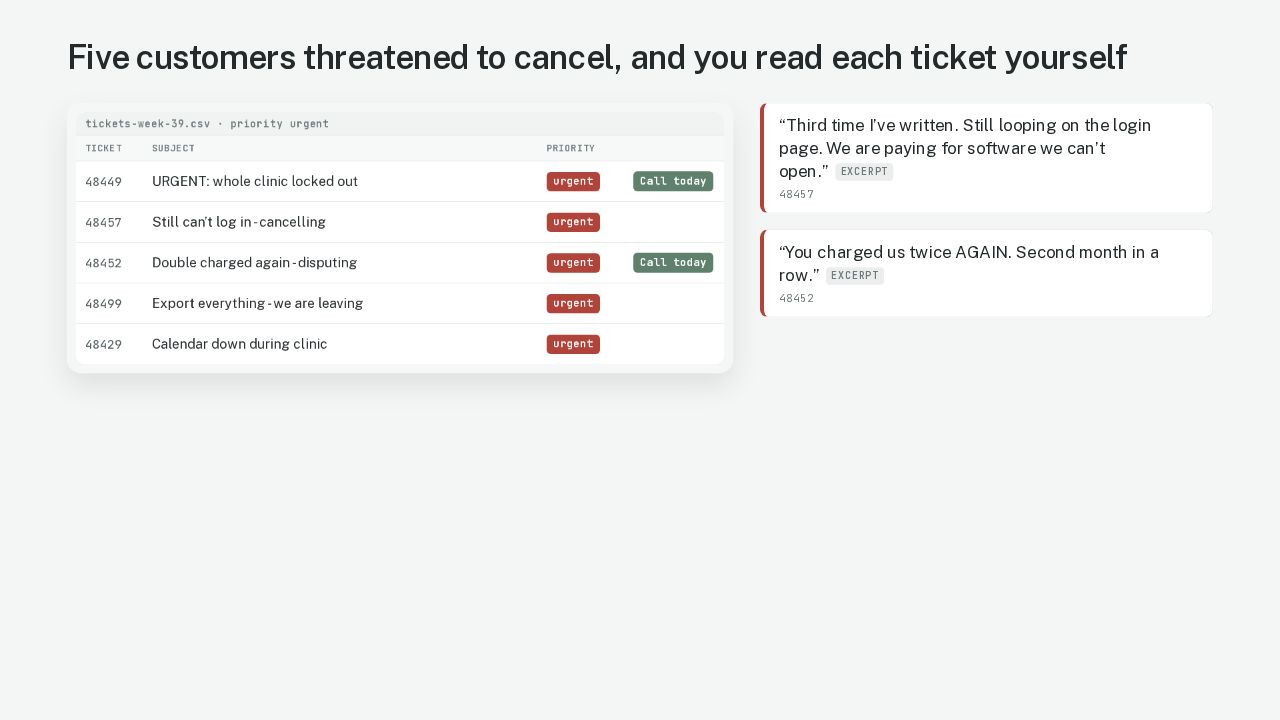
Skip the AI for the angry tickets. Claude listed all five urgent tickets, and each one talks about leaving. I still read all five myself. One clinic writes, we are paying for software we can't open. Another clinic got charged twice for the second month running and plans a bank dispute. A count says how many customers wrote. The note should also quote one of them in their own words. Before I send the note, I call the locked out clinic and the clinic that was charged twice.
You spend 42 of the 47 minutes on checks, urgent tickets and decisions
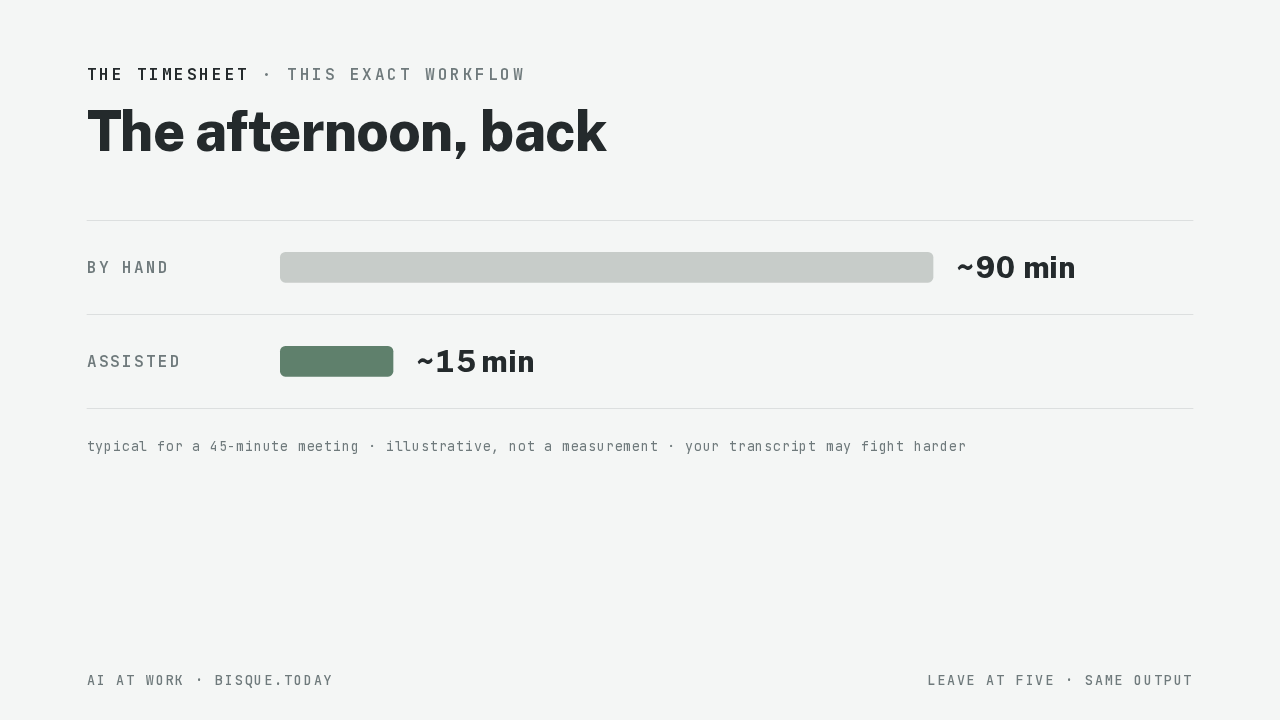
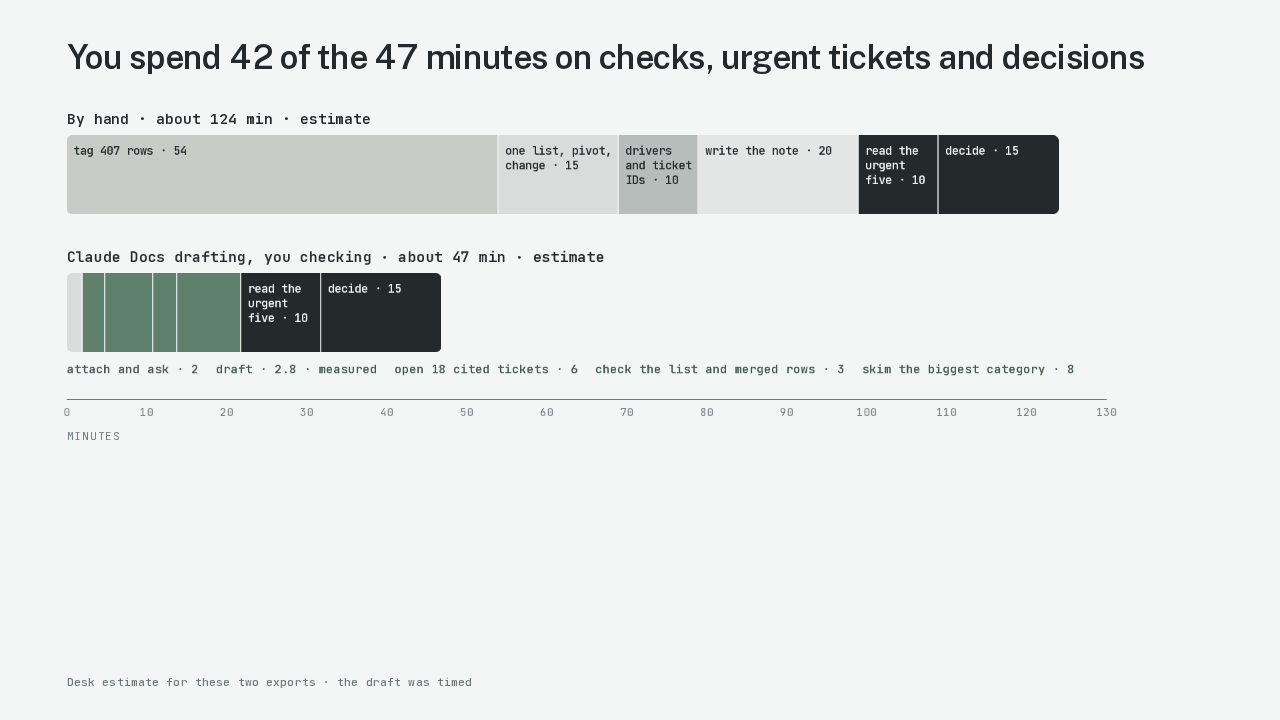
These are desk estimates, and I timed only the draft. By hand, tagging four hundred and seven rows, lining up both weeks and writing the note comes to about a hundred and twenty-four minutes. With Claude Docs, the whole job comes to about forty-seven minutes, and the draft uses under three. Seventeen minutes are checks, and the skim of the biggest category is eight of those. Reading the urgent tickets and deciding take twenty-five minutes on both bars.
The 40% login spike was 13 tickets from one release, filed under login
Back to Tollbeck's forty percent. Counted by root cause, account problems fell, from thirty tickets to twenty-seven. The jump came from Tuesday's bug, tagged by what customers typed. Which number in your last trends note was counted differently from the week before?