GeoLibre — a full map studio in a browser tab
GeoLibre
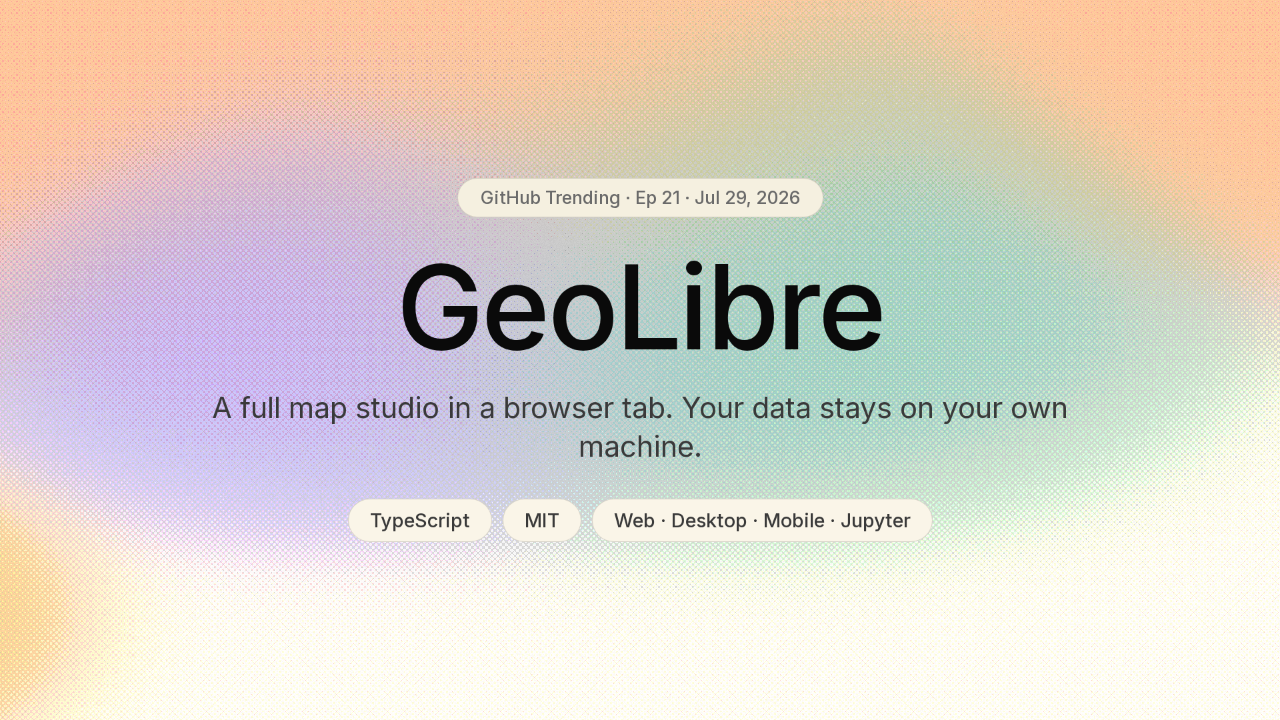
This is a full map studio that runs in a browser tab. It's called GeoLibre. Your data stays on your own machine. And the same app can fly the whole globe from Manhattan's 3D skyline all the way to the surface of Mars.
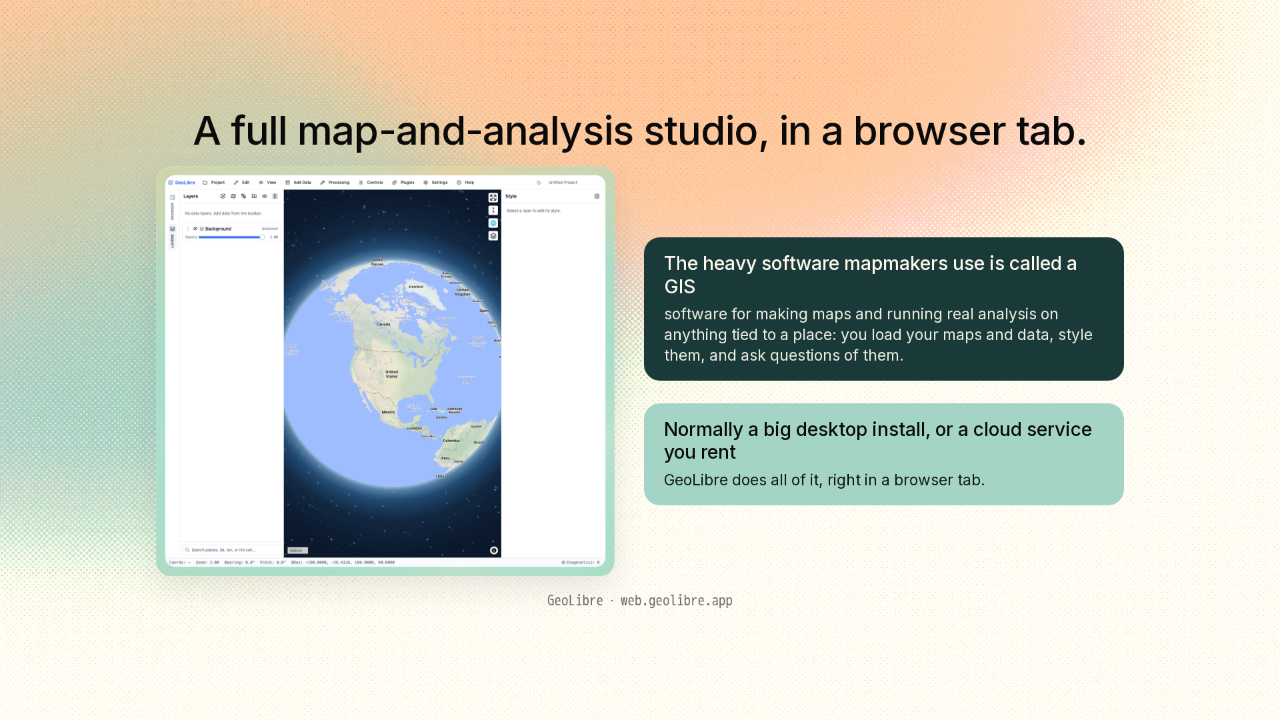
A full map-and-analysis studio, in a browser tab
A full map-and-analysis studio, in a browser tab.
Here's what GeoLibre is. Professionals who work with maps use a heavy kind of software called a GIS: you load your maps and data, style them, and run real analysis on anything tied to a place. Normally that's a big desktop install, or a cloud service you rent. GeoLibre does all of it, right in a browser tab.
Map software's old trade
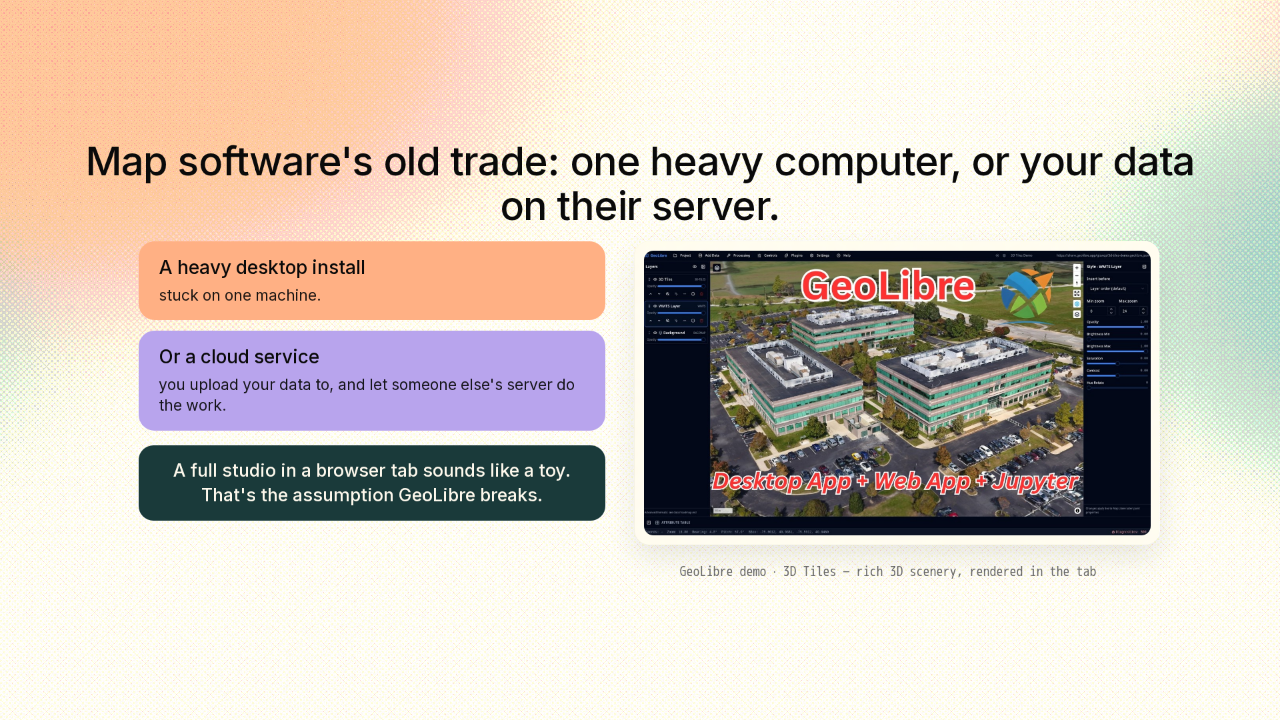
Map software's old trade: one heavy computer, or your data on their server.
So here's the catch you're expecting. Either you install a heavy program stuck on one computer, or you hand your data to a cloud service and let someone else's server do the work. So a full studio in a browser tab sounds like a toy. That's the assumption GeoLibre breaks.
The engines themselves run inside your tab
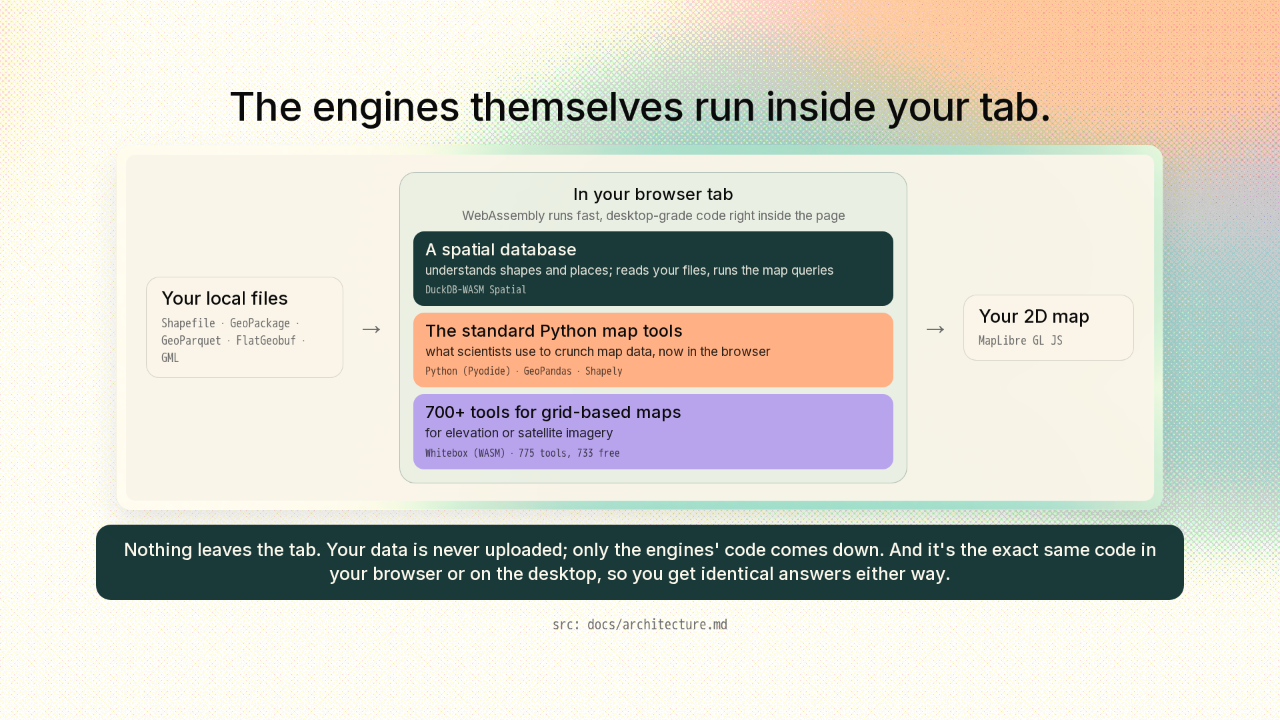
The engines themselves run inside your tab.
Here's the trick. The engines that do the heavy lifting were rebuilt to run in WebAssembly. That's a way to run fast, desktop-grade programs right inside a web page. So the heavy parts run in your tab, on your own files. One of them is a spatial database. That's a database that understands shapes and places, so you can ask it real map questions. It reads your local files and runs the queries. Beside it run the standard tools scientists use to crunch map data, written in a language called Python, now running inside the browser. And there are hundreds of tools for grid-based maps, the kind you use for elevation or satellite imagery. Over seven hundred of them, free. All of it runs on your machine, so your data never leaves it. Nothing gets uploaded to do the analysis. And here's the clever part. It's the exact same code whether it runs in your browser or on the desktop. So you get identical answers either way.
The same project runs in the browser, on desktop, on your phone, and in a notebook
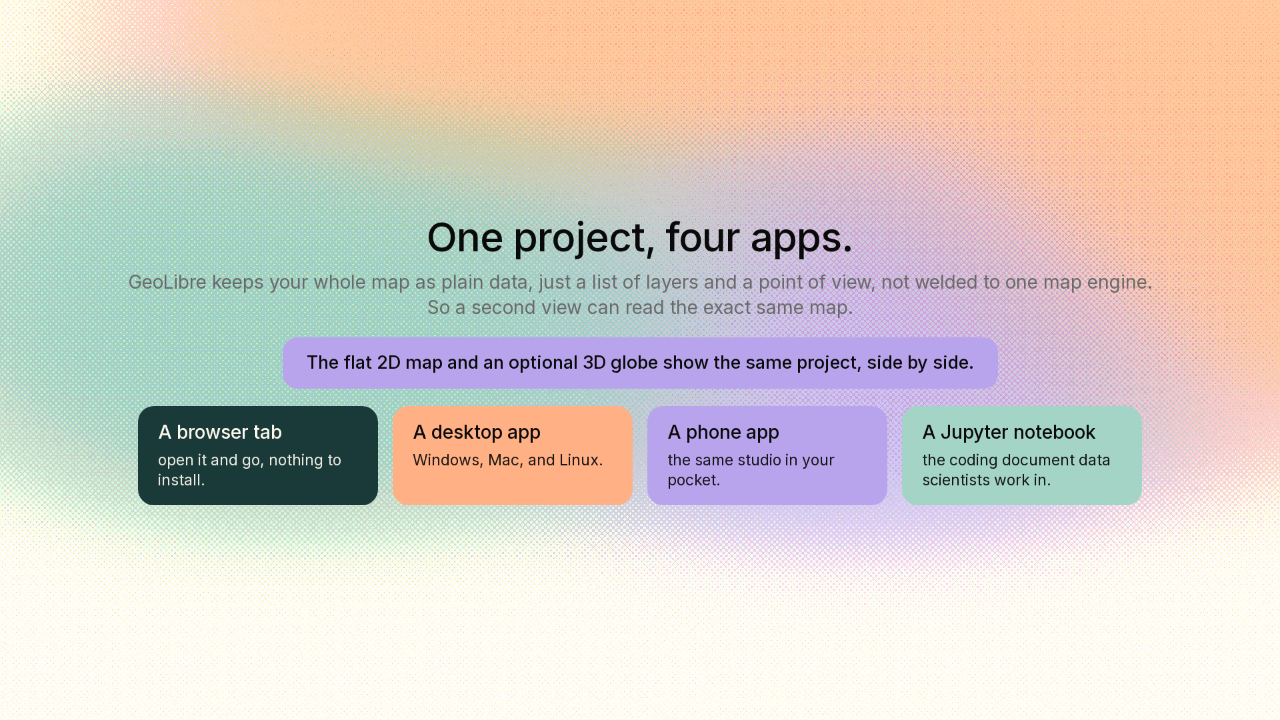
One project, four apps.
Now the second half. GeoLibre keeps your whole map as plain data, just a list of layers and a point of view, not something welded to one map engine. Because nothing is locked to a single engine, a second view can read the exact same map. So the flat 2D map and an optional 3D globe show the same project, side by side. And that's why the same code becomes four apps: a browser tab, a desktop app, a phone app, and a Jupyter notebook, the coding document data scientists work in.
Manhattan in 3D, coloured by the year each building went up
Manhattan in 3D, coloured by the year each building went up.
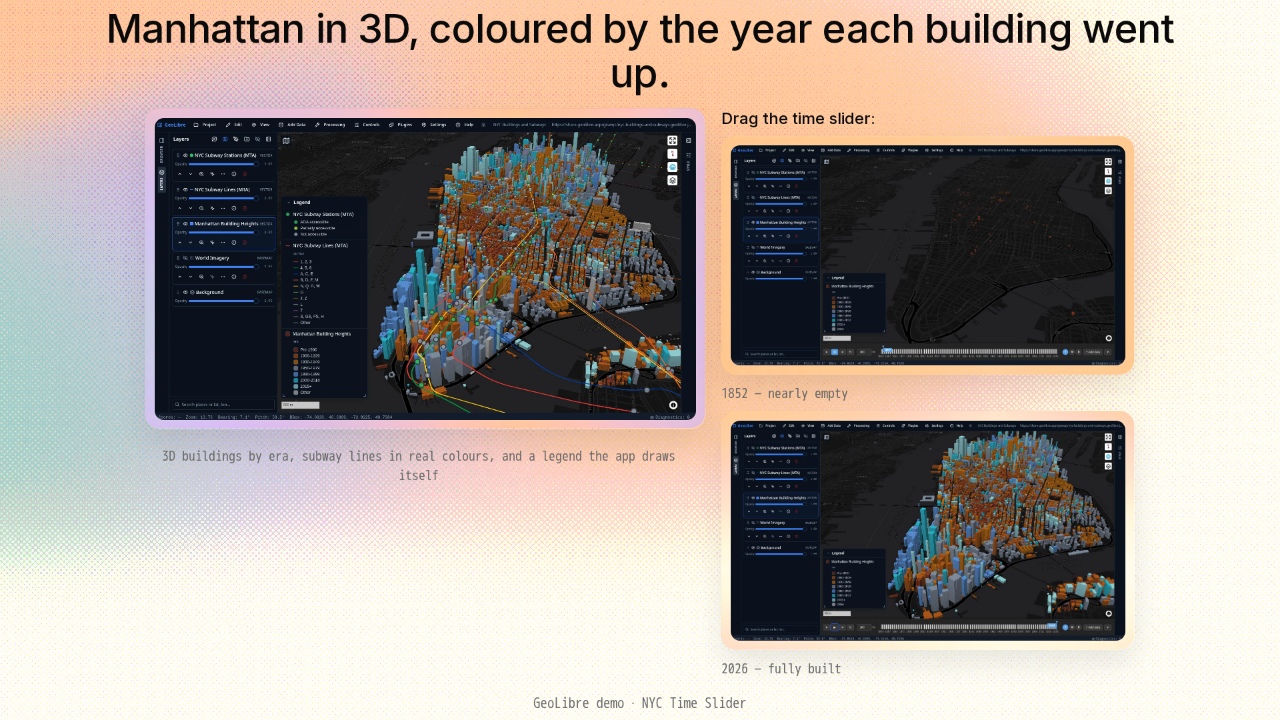
Now watch GeoLibre do real work. This is Manhattan, every building drawn in 3D and coloured by when it was built, from before 1900 up to the 2010s. And the app draws the legend itself, from the layers. Then you drag a time slider, and the city fills in, building by building, from the 1850s all the way to today. A century and a half of a city growing, right in your tab.
The same studio, on the Moon and Mars
The same studio, on the Moon and Mars.
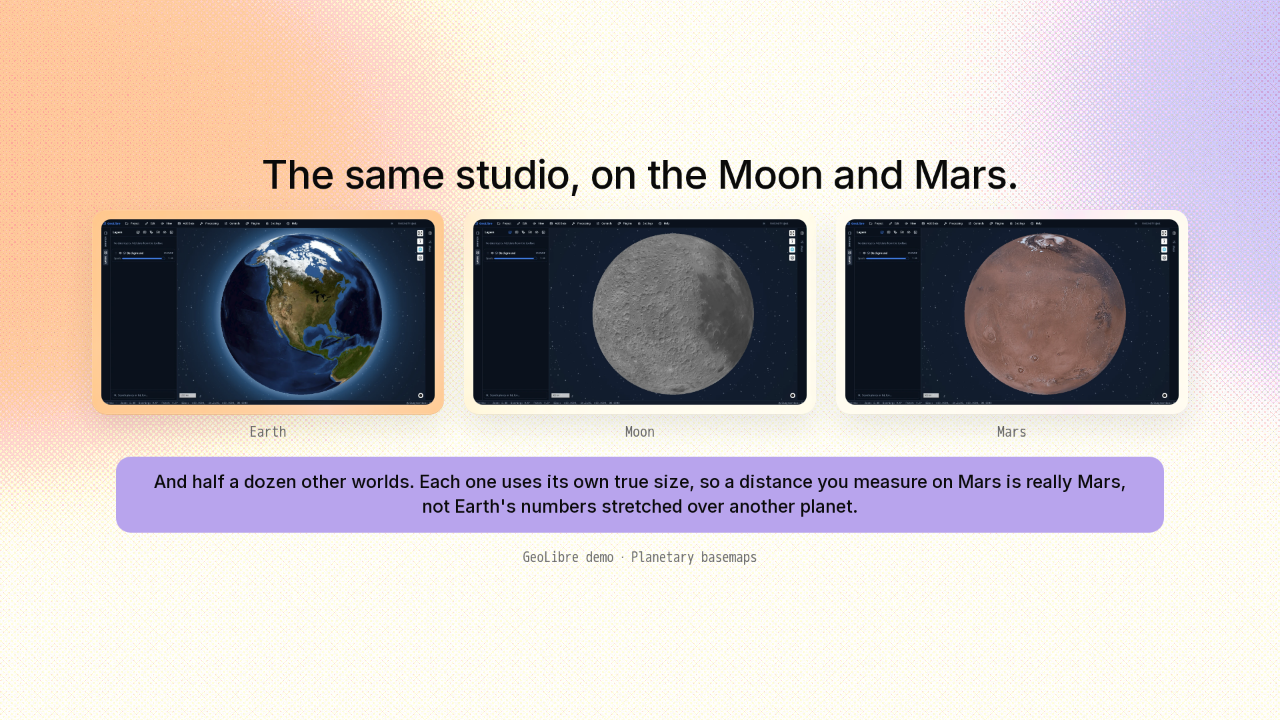
None of this is wired to Earth, so you can swap the whole globe. The same studio maps the Moon, Mars, and half a dozen other worlds. And each world uses its own true size, so a distance you measure on Mars is really Mars, not Earth's numbers stretched over another planet.
Open it in a tab, or install it anywhere
Open it in a tab, or install it anywhere.
# Nothing to install: open it in a tab
web.geolibre.app

# Or drop the whole studio into a notebook
$ pip install geolibre
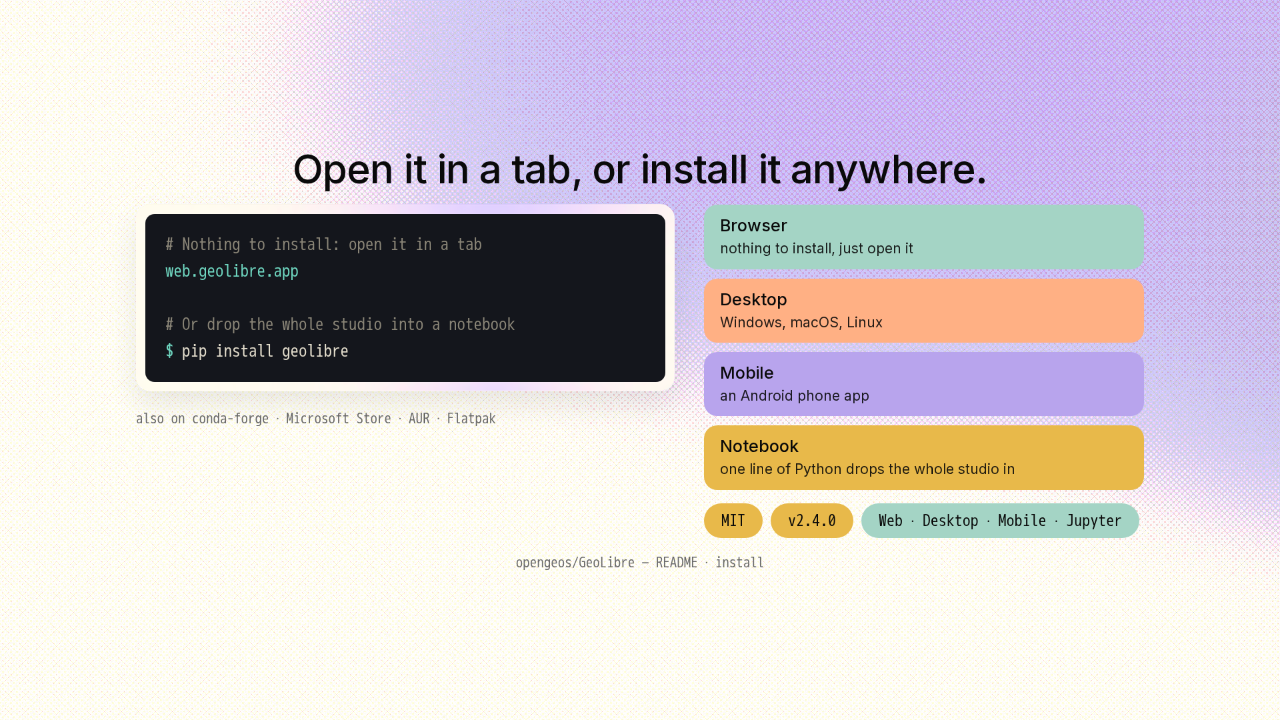
For the browser version, there's nothing to install. You just open it. Want it native? There are installers for Windows, Mac, and Linux, a phone app, and one line of Python drops the whole studio into a notebook. It's MIT-licensed. That means it's free for anyone to use, even in a paid product. Version 2.4.0 shipped today, under fast active development.
A full map studio, and its engines, on your own machine

A full map studio, and its engines, on your own machine, from a city block to Mars.
So that's GeoLibre. A full map studio, and its engines, running on your own machine, in a browser tab. From a single city block to the surface of Mars. The link's on screen, and there's a new repo tomorrow.