World Monitor
World
Monitor
Every conflict, market, and disaster signal on one live map, running on your own machine.
Welcome back to GitHub Trending, one open source project a day in a couple of minutes. Today it's World Monitor, a real time intelligence dashboard you host yourself. Every conflict, market and disaster signal on one live map, running on your own machine. TypeScript, open source under the A G P L, and it runs in the browser or as a native app on Mac, Windows and Linux. Let's dig in.
What it is
A situation room in a browser tab

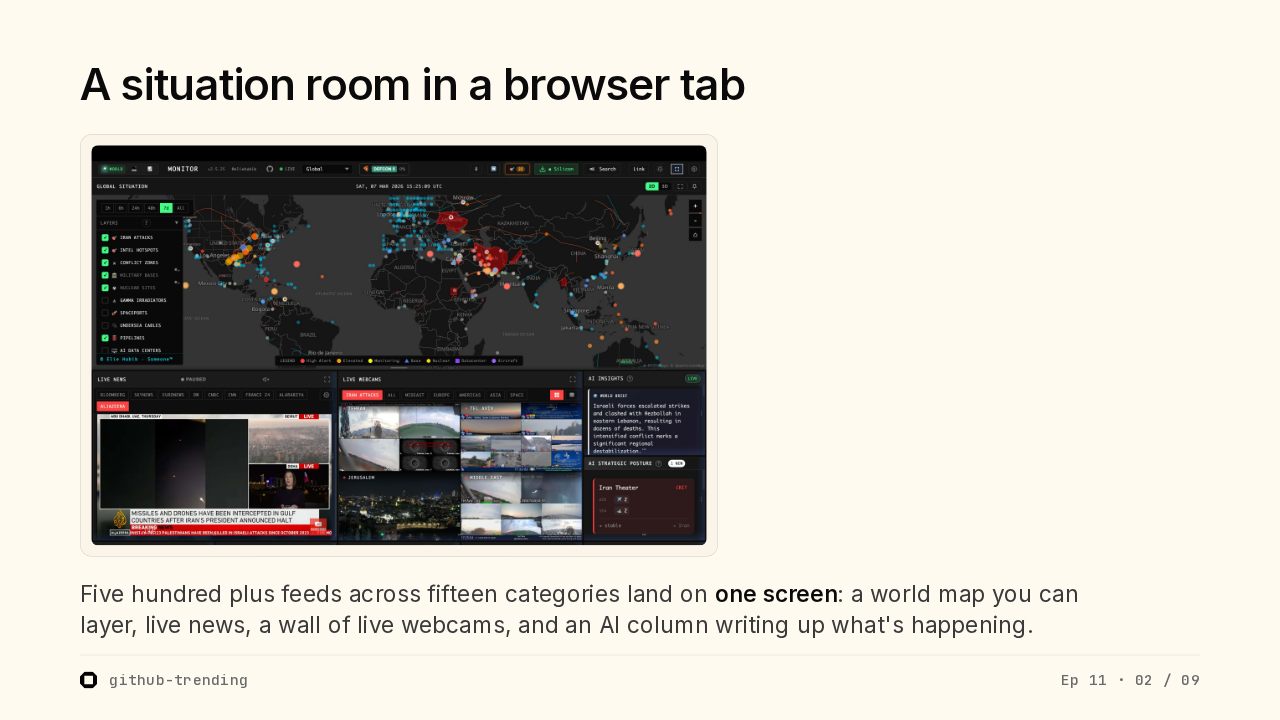
Five hundred plus feeds across fifteen categories land on one screen: a world map you can layer, live news, a wall of live webcams, and an AI column writing up what's happening.
 github-trending
Ep 11 · 02 / 09
github-trending
Ep 11 · 02 / 09
So what is it? World Monitor is a live situational awareness board that runs in a browser tab. A world map studded with alerts, layers you can toggle down the side, a panel of live news, and a whole wall of live webcams from wherever things are happening. Five hundred plus feeds across fifteen categories all land on one screen, with an AI column on the right writing up the picture. It's the kind of wall you'd picture in an operations centre, sitting in a browser tab.
Why it matters
Awareness is scattered by default
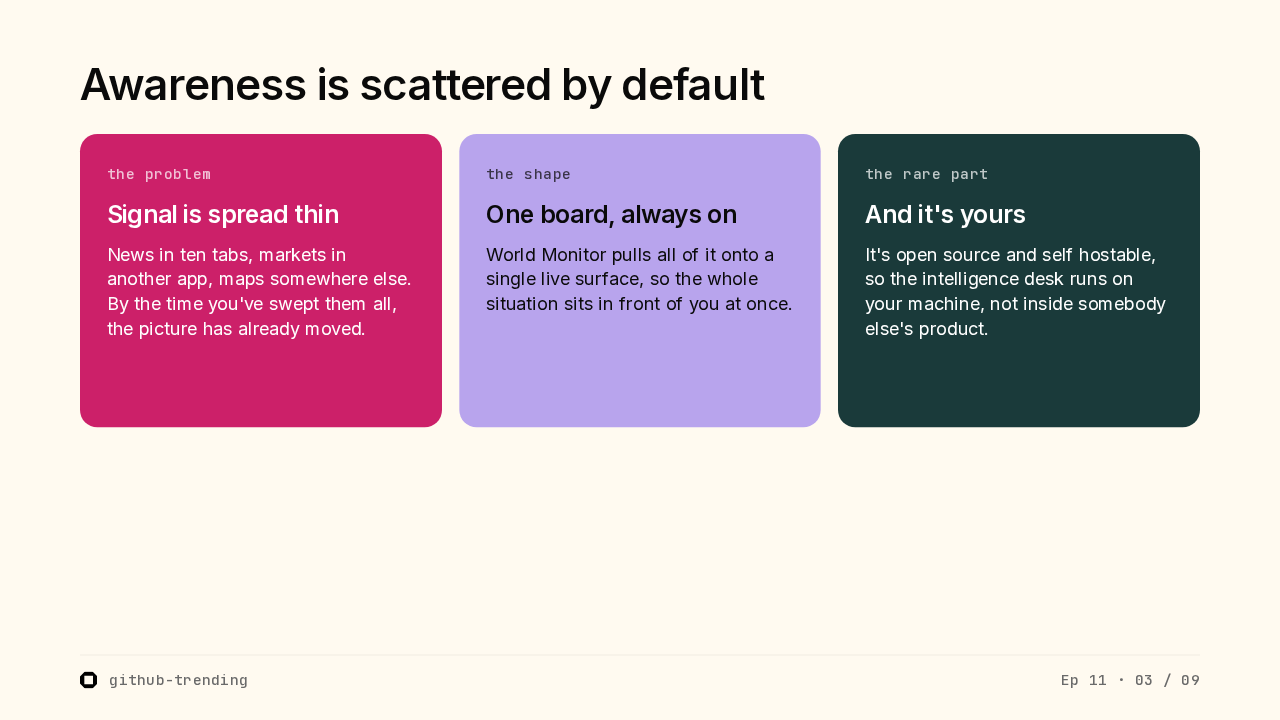
Signal is spread thin
News in ten tabs, markets in another app, maps somewhere else. By the time you've swept them all, the picture has already moved.
One board, always on
World Monitor pulls all of it onto a single live surface, so the whole situation sits in front of you at once.
And it's yours
It's open source and self hostable, so the intelligence desk runs on your machine, not inside somebody else's product.
github-trending
Ep 11 · 03 / 09
Why does this exist? Situational awareness is scattered on purpose. News in ten tabs, markets in another app, maps somewhere else, and by the time you've swept them all the picture's already moved. World Monitor pulls every bit of it onto one live board, so the whole situation sits in front of you at once. And here's the rare part. It's open source and self hostable. The intelligence desk runs on your machine, not inside someone else's product.
The core idea
It correlates the feeds, it doesn't just list them
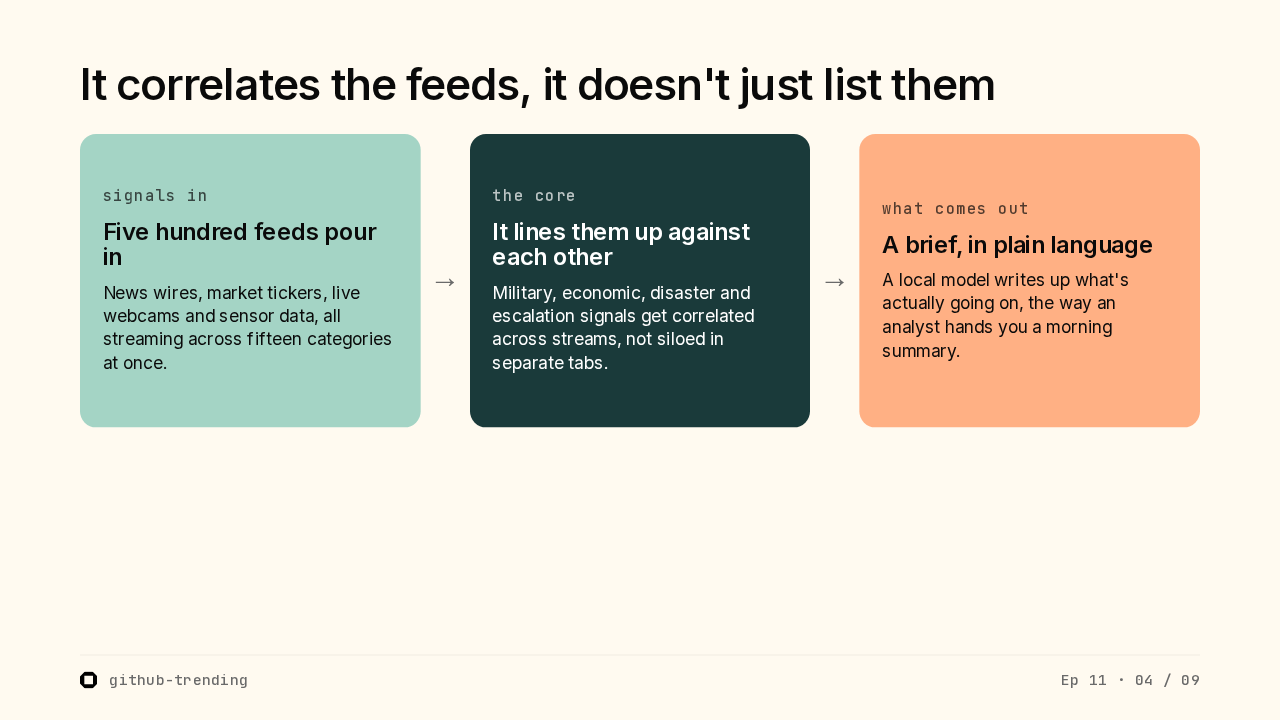
Five hundred feeds pour in
News wires, market tickers, live webcams and sensor data, all streaming across fifteen categories at once.
It lines them up against each other
Military, economic, disaster and escalation signals get correlated across streams, not siloed in separate tabs.
A brief, in plain language
A local model writes up what's actually going on, the way an analyst hands you a morning summary.
github-trending
Ep 11 · 04 / 09
Here's the idea that makes it more than a feed reader. Five hundred sources across fifteen categories pour in. News, markets, webcams, sensors. Now the useful part. It correlates across them. Military, economic, disaster and escalation signals get lined up against each other instead of sitting in separate tabs. And out comes a brief in plain language. A local model writes up what's happening, the way an analyst hands you a morning summary.
Instability index
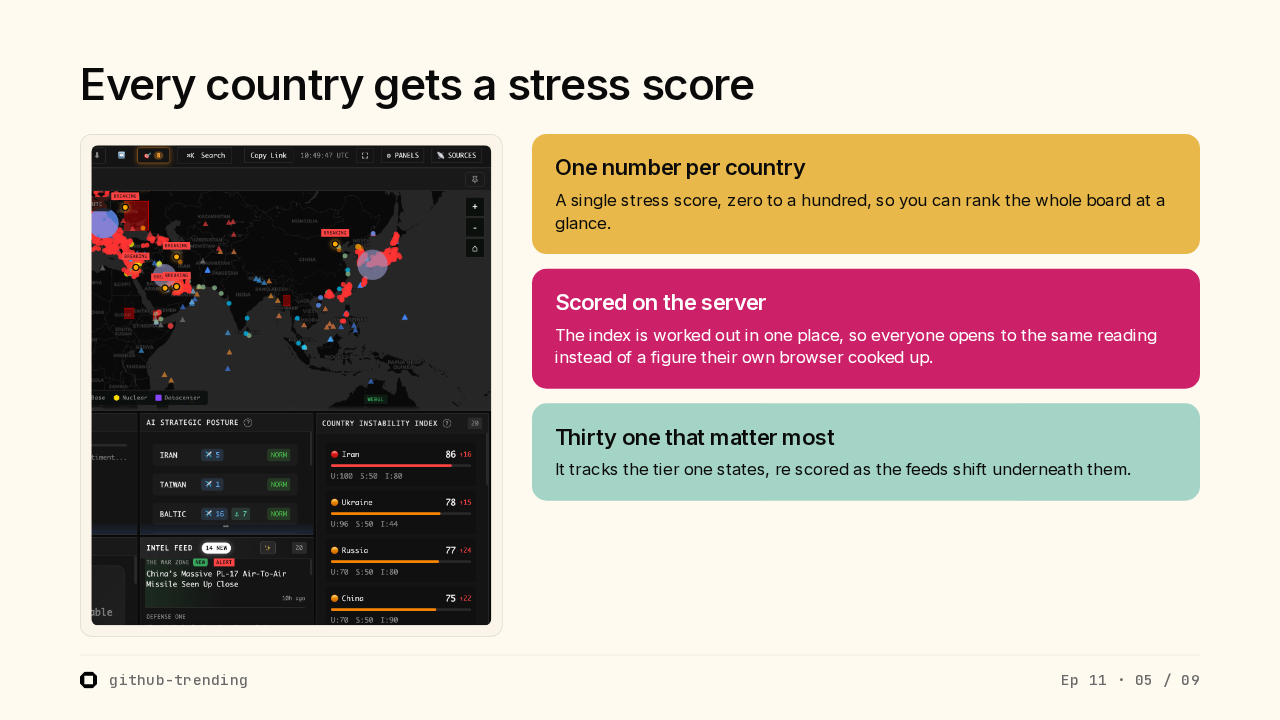
Every country gets a stress score
One number per country
A single stress score, zero to a hundred, so you can rank the whole board at a glance.
Scored on the server
The index is worked out in one place, so everyone opens to the same reading instead of a figure their own browser cooked up.
Thirty one that matter most
It tracks the tier one states, re scored as the feeds shift underneath them.
github-trending
Ep 11 · 05 / 09
That synthesis has a number attached. Down the right rail sits the analysis, and the panel I keep watching is the Country Instability Index. Every tracked country carries one stress score, zero to a hundred, so you can rank the whole board in a single glance. It's worked out on the server, so everyone opens to the same reading instead of a figure their own browser cooked up. Thirty one of the states that matter most, re scored as the feeds shift under them.
On the map
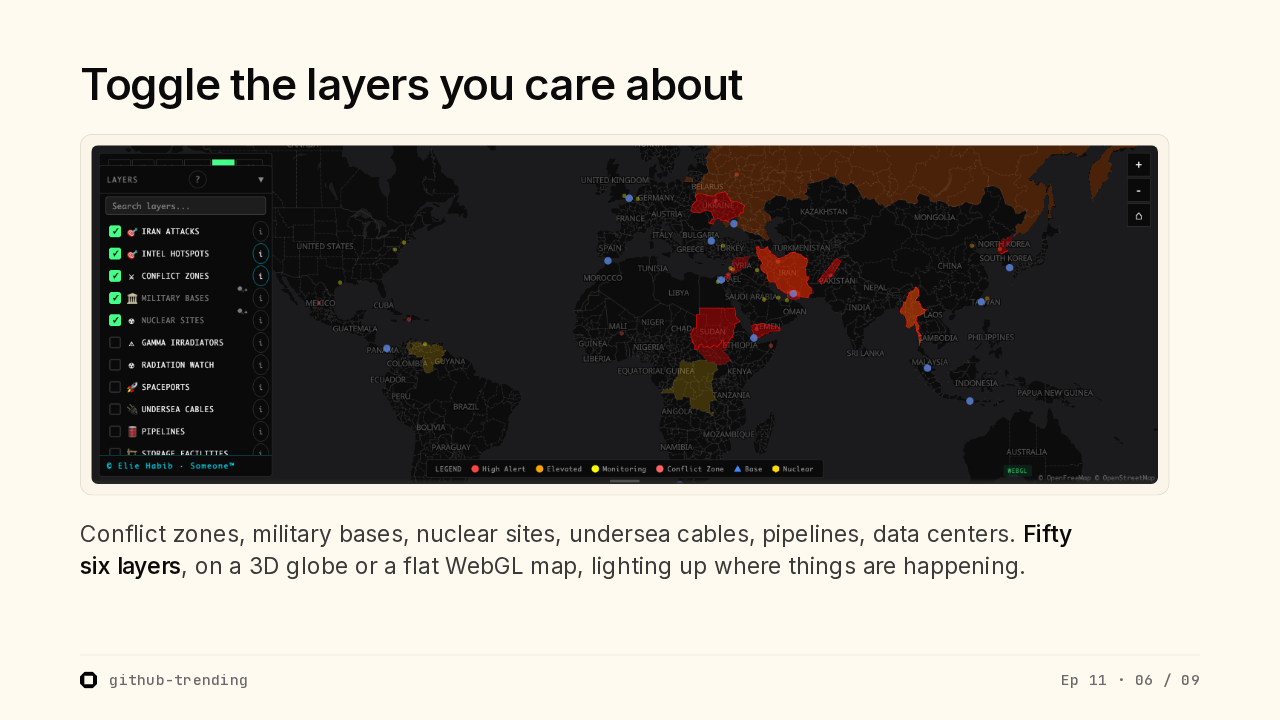
Toggle the layers you care about

Conflict zones, military bases, nuclear sites, undersea cables, pipelines, data centers. Fifty six layers, on a 3D globe or a flat WebGL map, lighting up where things are happening.
github-trending
Ep 11 · 06 / 09
The map is the centre of it. You flip on the layers you care about. Conflict zones, military bases, nuclear sites, undersea cables, pipelines, data centres. Fifty six of them in all. Spin the world as a three D globe, or flatten it to a WebGL map, and the alerts light up right where they're happening.
Your own AI, and an API
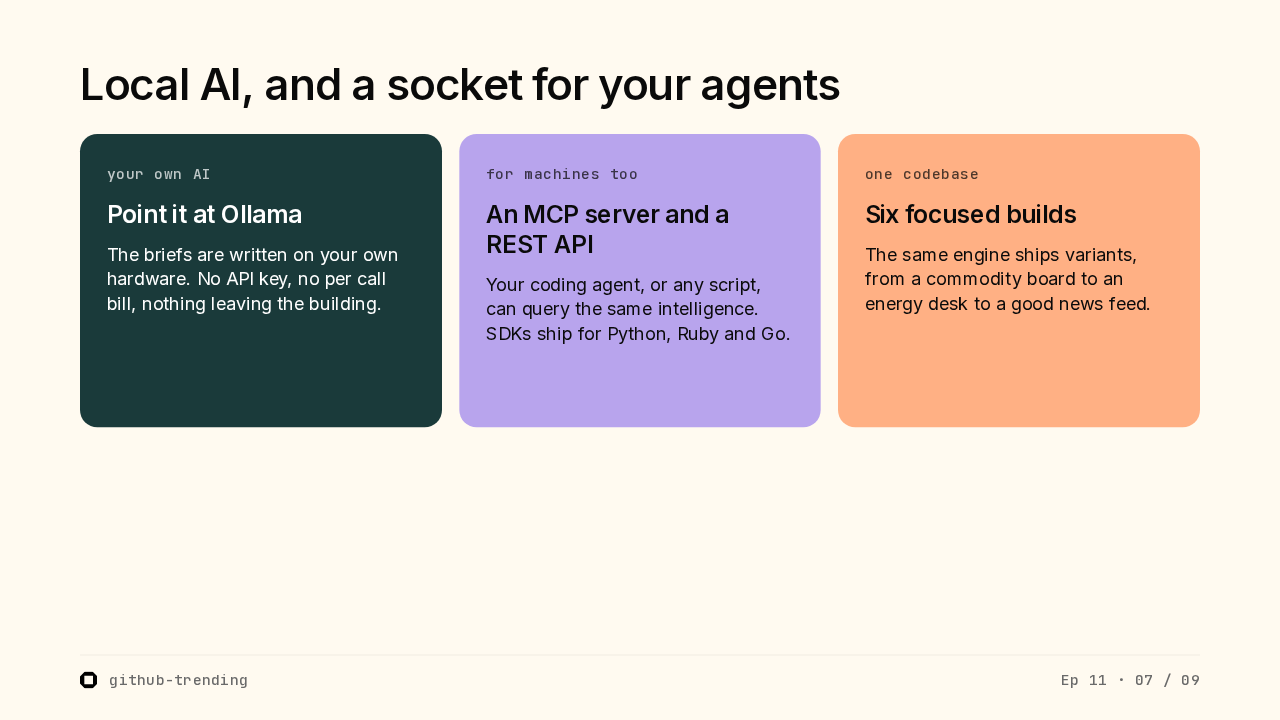
Local AI, and a socket for your agents
Point it at Ollama
The briefs are written on your own hardware. No API key, no per call bill, nothing leaving the building.
An MCP server and a REST API
Your coding agent, or any script, can query the same intelligence. SDKs ship for Python, Ruby and Go.
Six focused builds
The same engine ships variants, from a commodity board to an energy desk to a good news feed.
github-trending
Ep 11 · 07 / 09
Two things here that developers will like. The AI is local. Point it at Ollama and the briefs are written on your own hardware. No key to paste, no per call bill, nothing leaving the building. And it's not just a website. It's an MCP server and a REST API, so your agent, or a plain script, can pull the same intelligence, with SDKs for Python, Ruby and Go. One codebase even ships focused builds. A commodity board, an energy desk, right down to a good news feed.
Get it
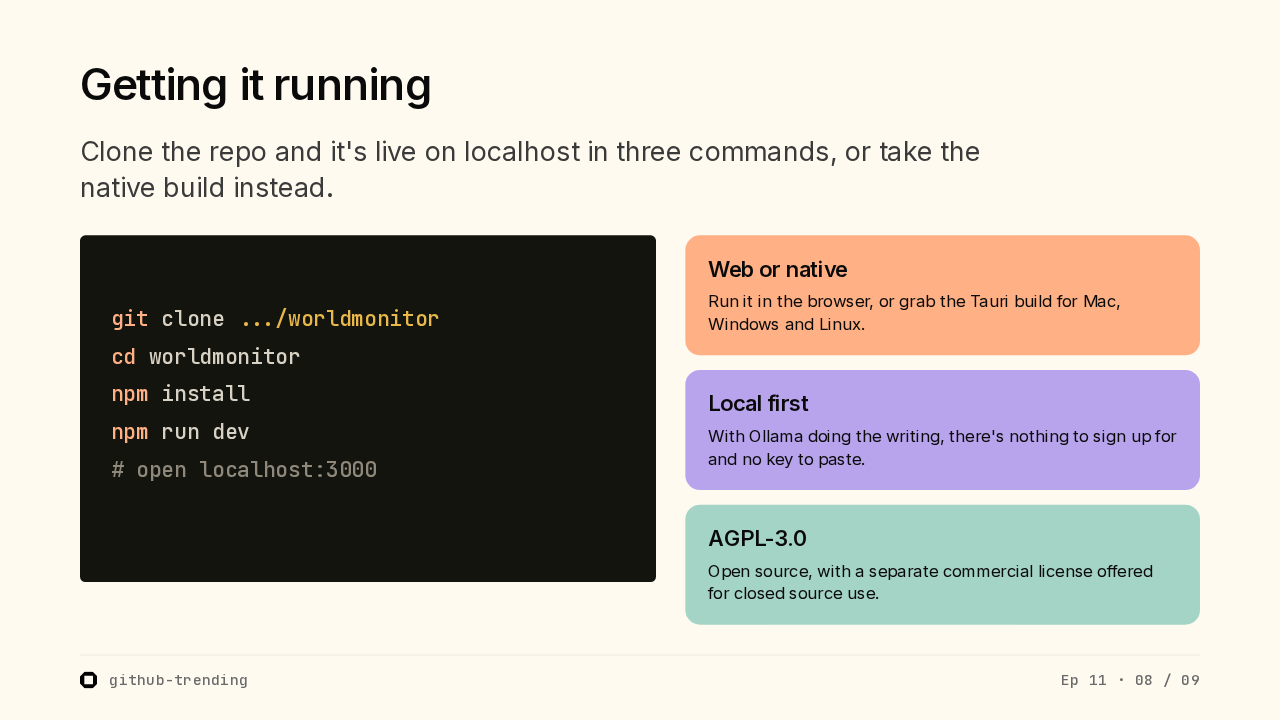
Getting it running
Clone the repo and it's live on localhost in three commands, or take the native build instead.
Web or native
Run it in the browser, or grab the Tauri build for Mac, Windows and Linux.
Local first
With Ollama doing the writing, there's nothing to sign up for and no key to paste.
AGPL-3.0
Open source, with a separate commercial license offered for closed source use.
github-trending
Ep 11 · 08 / 09
Getting it running is quick. Clone the repo and it's live on localhost in about three commands. Install, run dev, open the browser, and there's your board. Or skip that and take the native build for Mac, Windows or Linux. Either way it's local first. With Ollama writing the briefs there's nothing to sign up for. It's under the A G P L, open source, with a commercial license on offer if you need to keep your own changes closed.
Wrap
Your own intelligence desk, on your own machine.
New repo tomorrow.
So that's World Monitor. Every conflict, market and disaster signal correlated onto one live board, with the AI running on your own machine. The link's on screen if you want to stand up your own. New repo tomorrow. See you then.