hotpath 0.29 counts exact instructions per function with Callgrind
2 hours ago
hotpath 0.29 can count the exact instructions each measured function runs, by profiling under Valgrind's Callgrind. A single feature flag now turns on a profiling mode. And two command-line changes break scripts: one command is renamed, and hotpath-utils is removed.
Ask about this presentation
Chapters
Show transcriptHide transcript
hotpath 0.29 can count the exact instructions each measured function runs, by profiling under Valgrind's Callgrind. A single feature flag now turns on a profiling mode. And two command-line changes break scripts: one command is renamed, and hotpath-utils is removed.
Slide text
~$ hotpath-rsadded changed fixed breaking upgrade
release v0.29.0
hotpath 0.29 counts exact instructions per function with Callgrind
Also: one feature flag per profiling mode, and two command-line changes that break scripts.
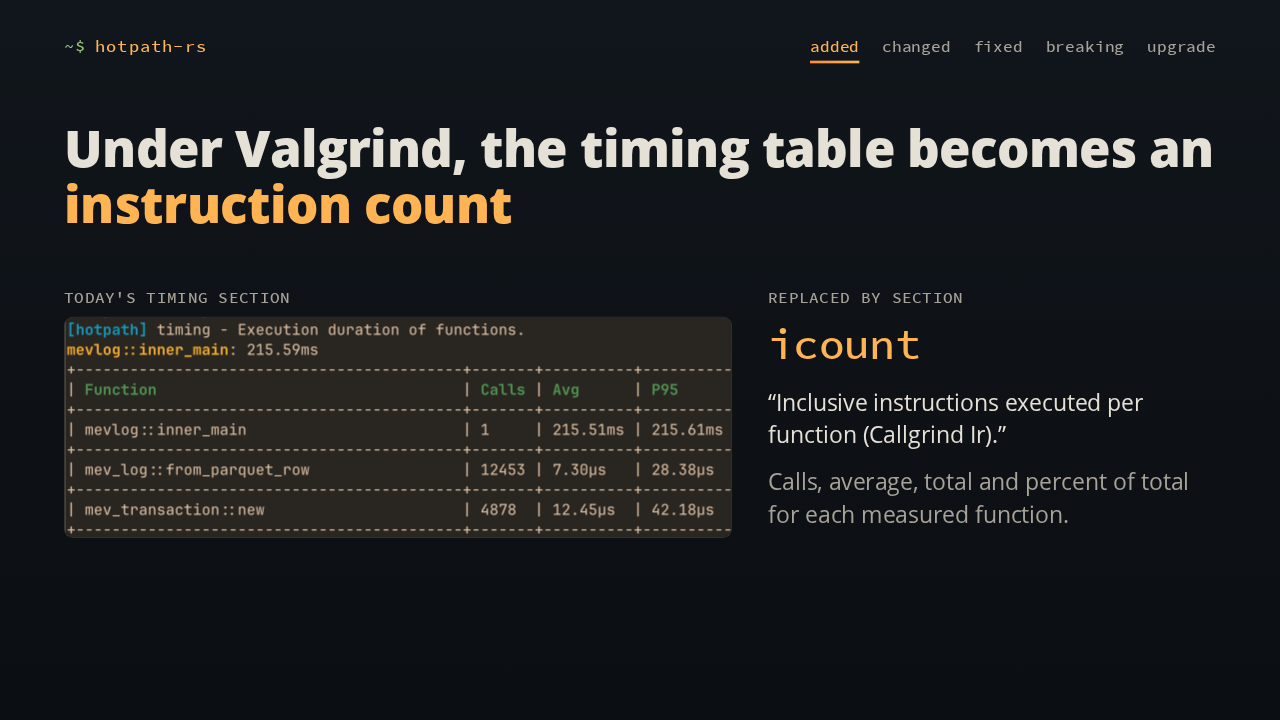
Here's the timing table hotpath prints today. Under Valgrind, those durations stop meaning anything. So a build with the new hotpath-callgrind feature reports an icount section in its place: the inclusive instructions each measured function executed, with calls, an average, a total, and a share of the run.
Slide text
~$ hotpath-rsadded changed fixed breaking upgradeUnder Valgrind, the timing table becomes an instruction count
today's timing section

replaced by section
icount
“Inclusive instructions executed per function (Callgrind Ir).”
Calls, average, total and percent of total for each measured function.
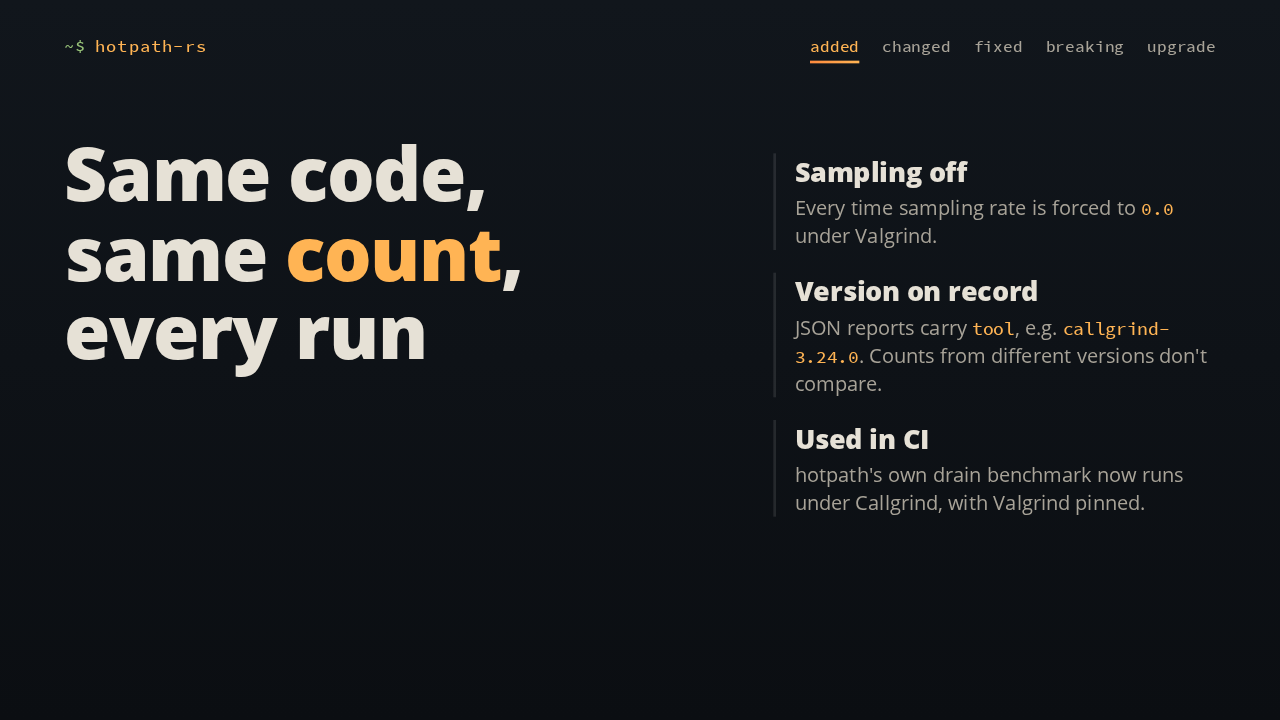
Instruction counts are deterministic, so they make a steady number to compare in CI. To keep them that way, hotpath turns time sampling off under Valgrind, since a random draw would change a caller's count between runs. The JSON report records which Callgrind version counted, and hotpath's own drain benchmark now runs this way.
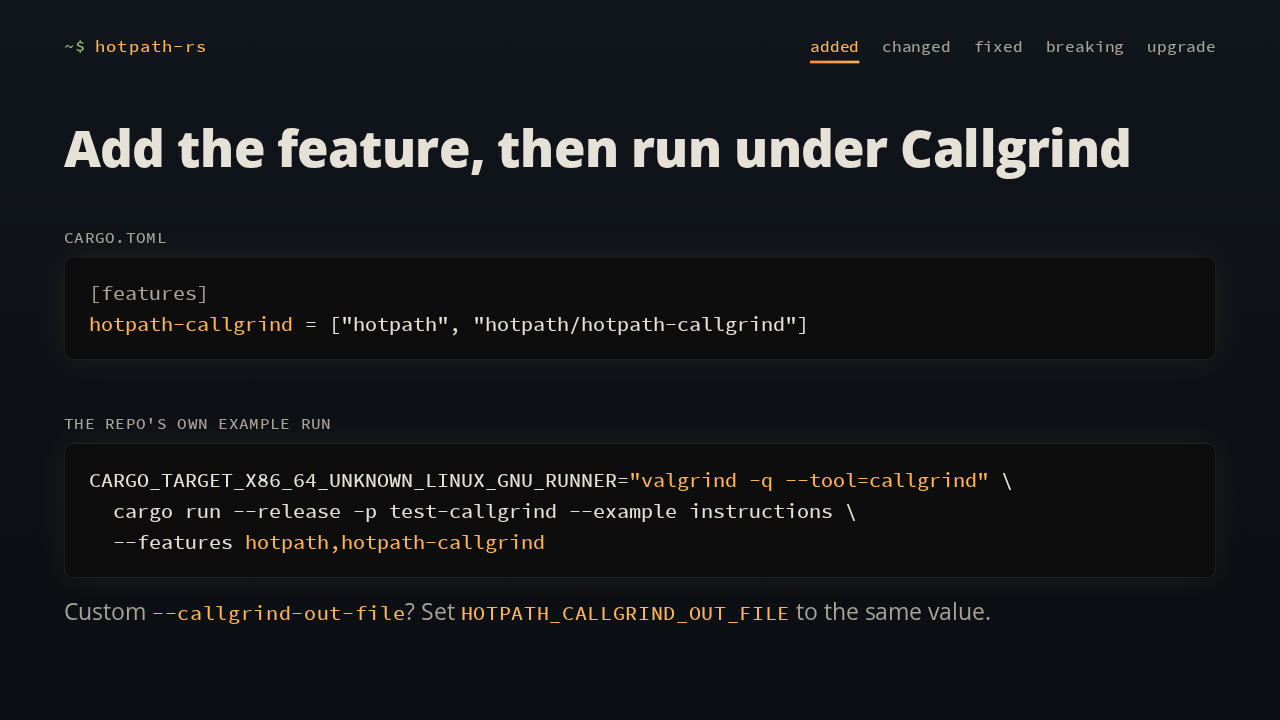
To turn it on, add a feature to your crate that enables hotpath-callgrind. Then run under Valgrind's Callgrind tool. The repo's example sets Cargo's runner to do it. With a custom output file, set HOTPATH_CALLGRIND_OUT_FILE to match. Run normally, the same build prints timing, for one extra call per measured invocation.
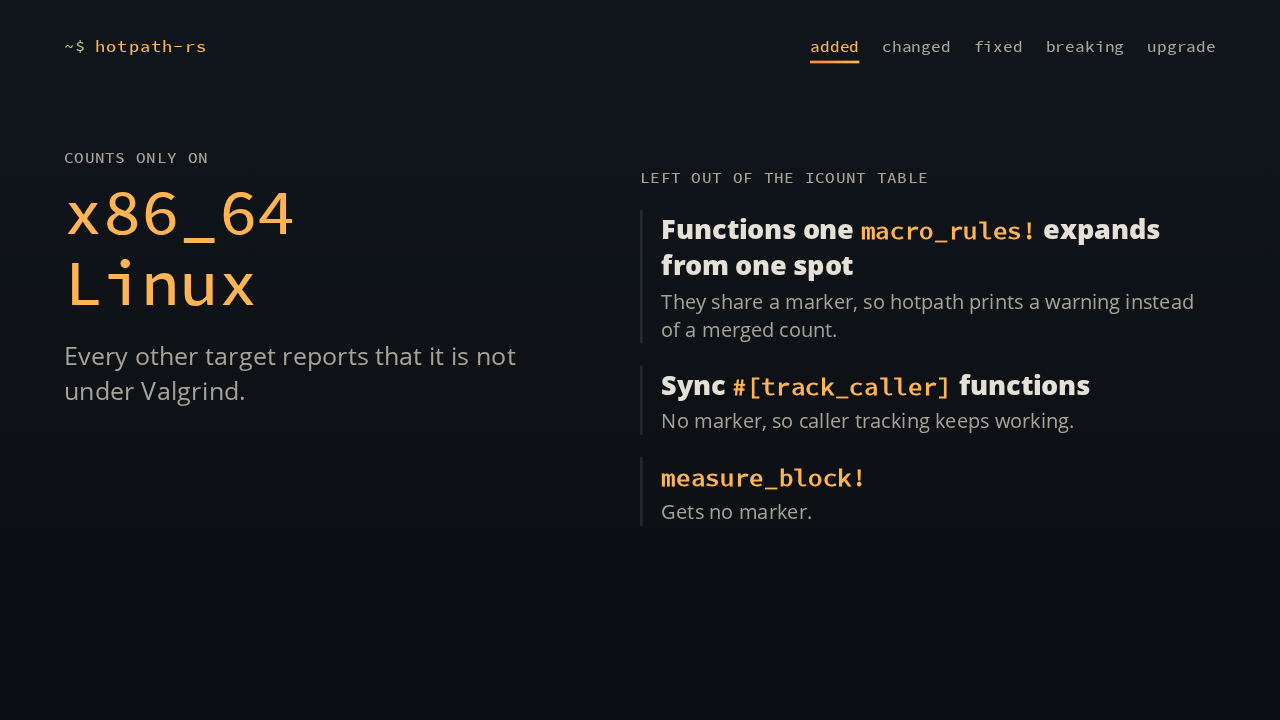
Counting only works on x86_64 Linux. And a few functions are left out. When one macro_rules definition expands several measured functions from the same spot, they share a marker, so hotpath warns instead of merging their counts. Synchronous track_caller functions and measure_block get no counts.
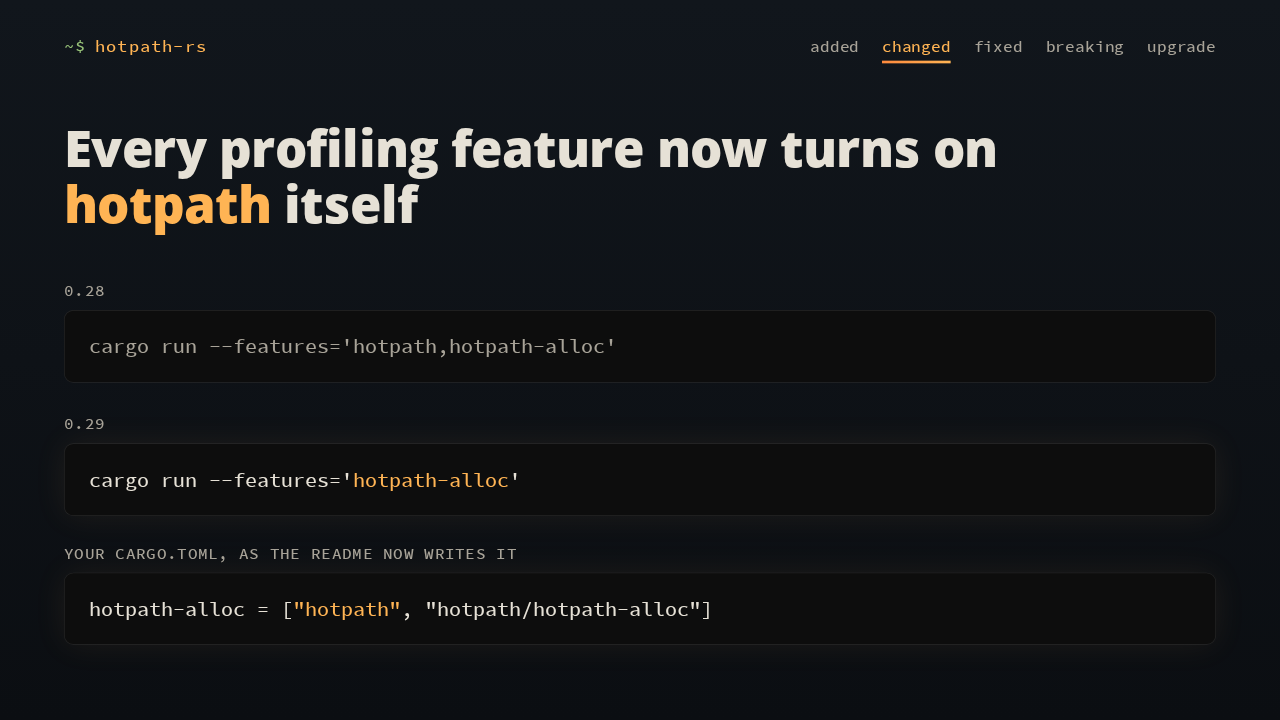
In 0.28, profiling allocations meant passing two features, hotpath and hotpath-alloc. Now every profiling feature turns on hotpath by itself, so one flag is enough. The README lists hotpath first in your own feature, too. Old two-flag commands still build.
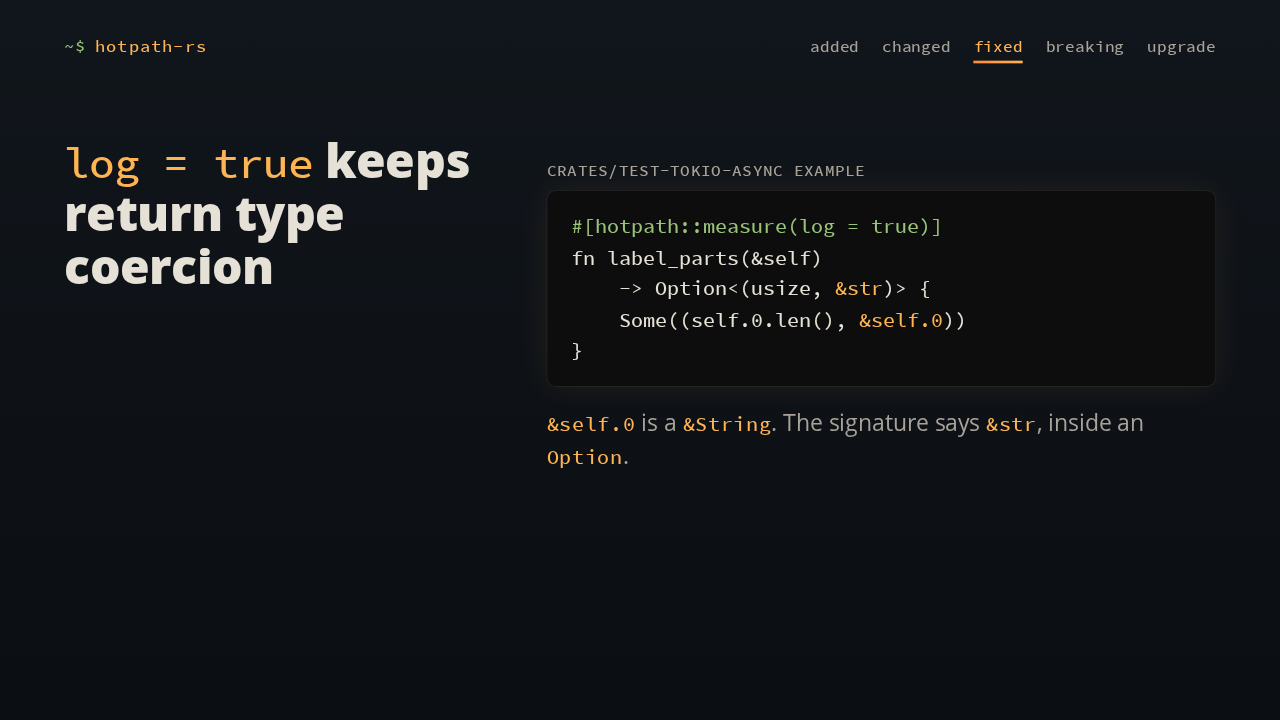
A fix for log equals true. This function returns a reference to a String where its signature promises a string slice, inside an Option. The logging wrapper now keeps that coercion to the declared return type.
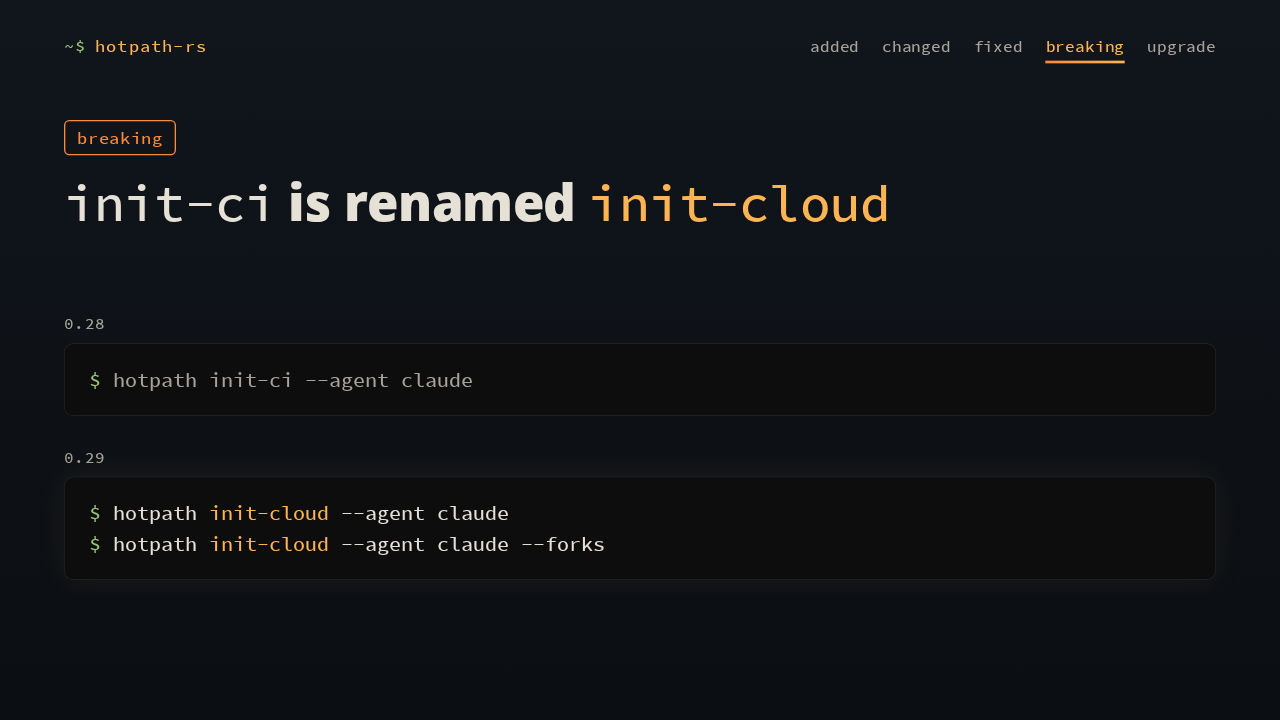
The first breaking change renames init-ci, the command that sets up hotpath Cloud CI through your coding agent. It's now init-cloud, with the same agent option and the same forks flag. Update any script or doc that calls the old name.
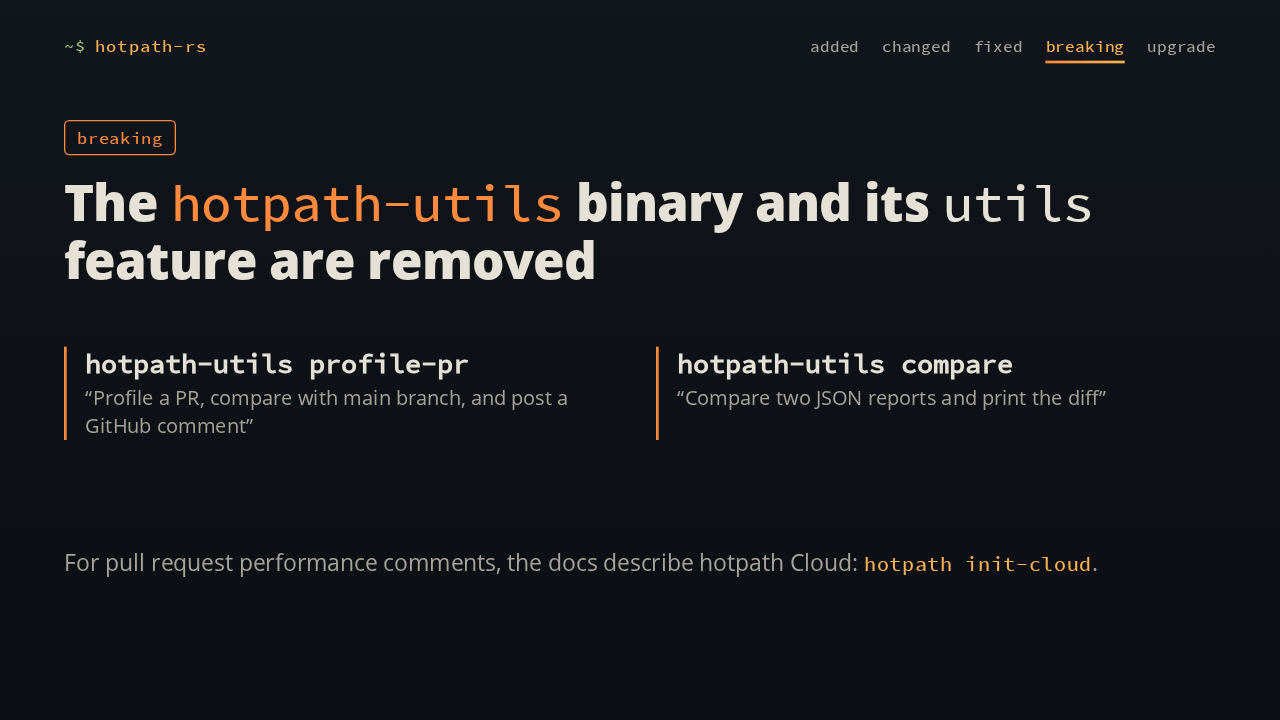
The second removes the hotpath-utils binary and the utils feature that built it. Its two commands go too: profile-pr, which profiled a pull request against main and posted a GitHub comment, and compare, which diffed two JSON reports. For pull request comments, the docs describe hotpath Cloud.
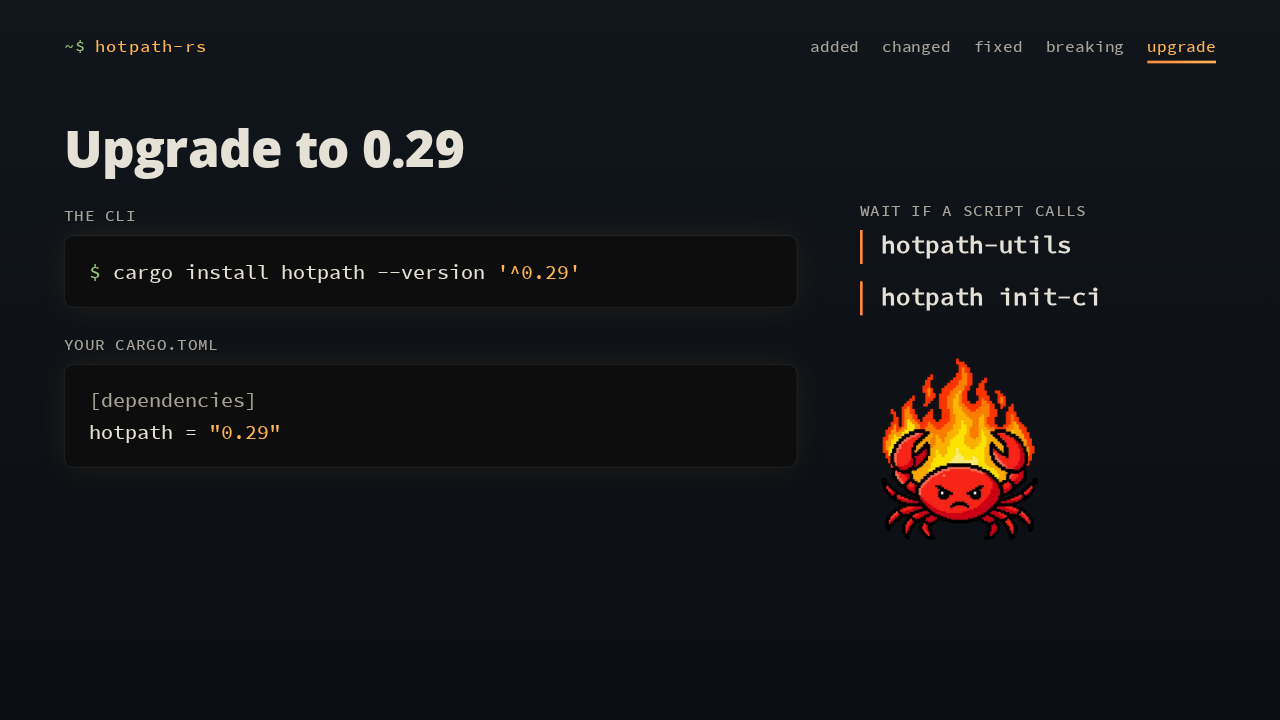
To upgrade, install the CLI at 0.29 and bump the dependency to 0.29. Hold off if a script still calls hotpath-utils or init-ci. Instruction counts need x86_64 Linux. Everywhere, 0.29 takes one feature flag where it took two, and on Linux it now counts the instructions your measured functions run.
Slide text
~$ hotpath-rsadded changed fixed breaking upgradeUpgrade to 0.29
the CLI
$ cargo install hotpath --version '^0.29'
your Cargo.toml
[dependencies]
hotpath = "0.29"
wait if a script calls
hotpath-utils
hotpath init-ci